

Answered step by step
Verified Expert Solution
Question
1 Approved Answer
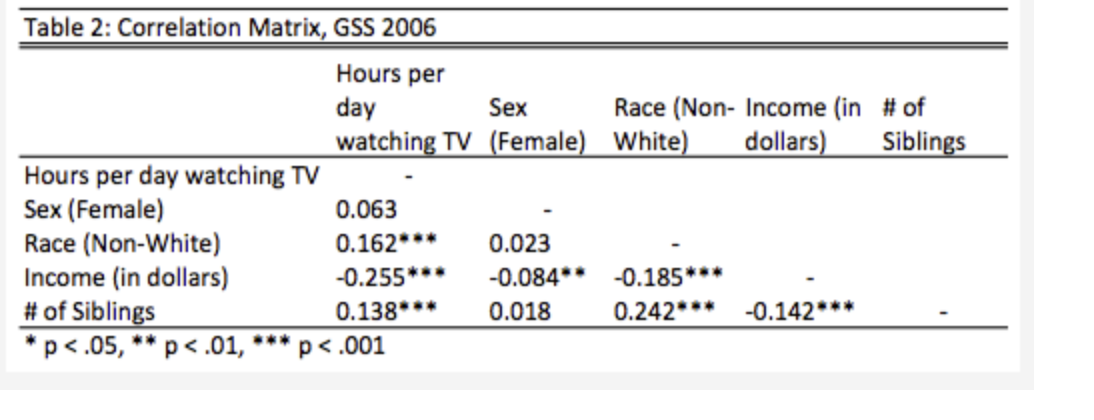
Using the table below, describe completely each statistically significant relationship shown in the correlation matrix. Table 2: Correlation Matrix, GSS 2006 Hours per day Sex
Using the table below, describe completely each statistically significant relationship shown in the correlation matrix.
Step by Step Solution
There are 3 Steps involved in it
Step: 1

Get Instant Access to Expert-Tailored Solutions
See step-by-step solutions with expert insights and AI powered tools for academic success
Step: 2

Step: 3
Ace Your Homework with AI
Get the answers you need in no time with our AI-driven, step-by-step assistance
Get Started
Birds Higher Engineering Mathematics
Authors: John Bird
9th Edition
1000353036, 9781000353037