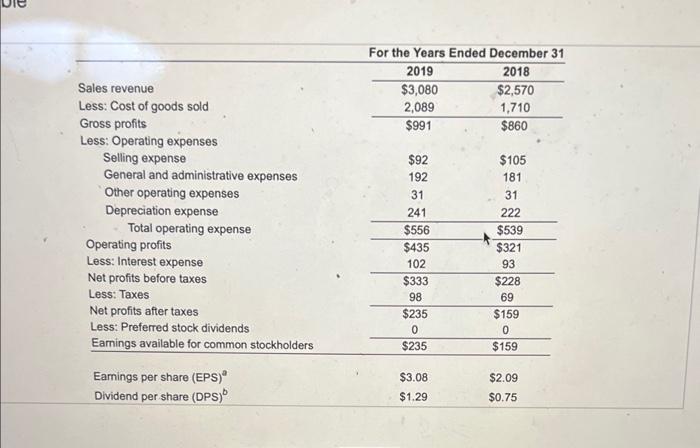
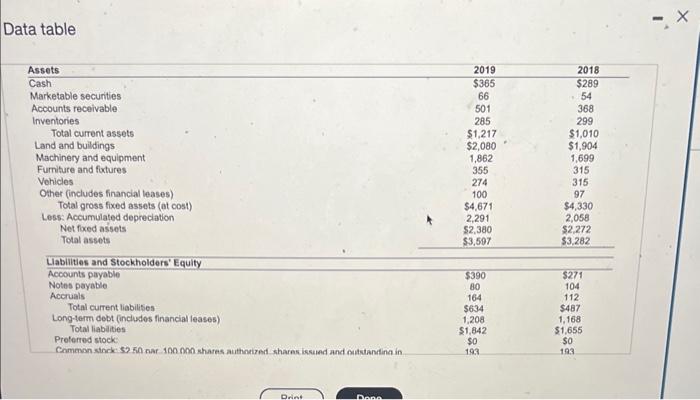
Using the tables below, conduct a complete ratio analysis of the Bartleti Company for the years 2018 and 2019 . You should assess the firm's liquidity, activity, debt, and profitablty ratios. Highlight any particularty positive or negative developenents that you uncover when comparing ratios from 2018 and 2019. Bartient Company income Statements Bartest Company Balance Sheets Bartieft Company Statement of Retained Eamings (Round to three decimal places.) For the Years Ended December 31 Sales revenue Less: Cost of goods sold Gross profits \begin{tabular}{cc} 2019 & 2018 \\ \hline$3,080 & $2,570 \\ 2,089 & 1,710 \\ \hline$991 & $860 \end{tabular} Less: Operating expenses Selling expense General and administrative expenses Other operating expenses Depreciation expense Total operating expense Operating profits Less: Interest expense Net profits before taxes Less: Taxes Net profits after taxes Less: Preferred stock dividends Earnings available for common stockholders \begin{tabular}{cc} $92 & $105 \\ 192 & 181 \\ 31 & 31 \\ 241 & 222 \\ \hline$556 & $539 \\ \hline$435 & $321 \\ 102 & 93 \\ \hline$333 & $228 \\ 98 & 69 \\ \hline$235 & $159 \\ 0 & 0 \\ \hline$235 & $159 \\ \hline \end{tabular} Eamings per share (EPS) a Dividend per share (DPS) b $3.08$1.29$2.09$0.75 Data table Preferred stock: Common stock: $2.50 par, 100,000 shares authorized, shares issued and outstanding in 2019: 76,262; in 2018: 76,244 Paid-in capital in excess of par on common stock Retained earnings Total stockholders' equity Total liabilities and stockholders' equity \begin{tabular}{cc} 193 & $193 \\ & \\ 426 & 425 \\ 1,136 & 1,009 \\ $1,755 & $1,627 \\ $3,597 & $3,282 \\ \hline \end{tabular} (Click the icon here [ in order to copy the contents of the data table below into a spreadsheet.)