Using the transactions worksheet, balance sheet, and activity statement from Childs Play, Part 1 (please see below), prepare a cash flow statement for Childs Play for FY 2018. 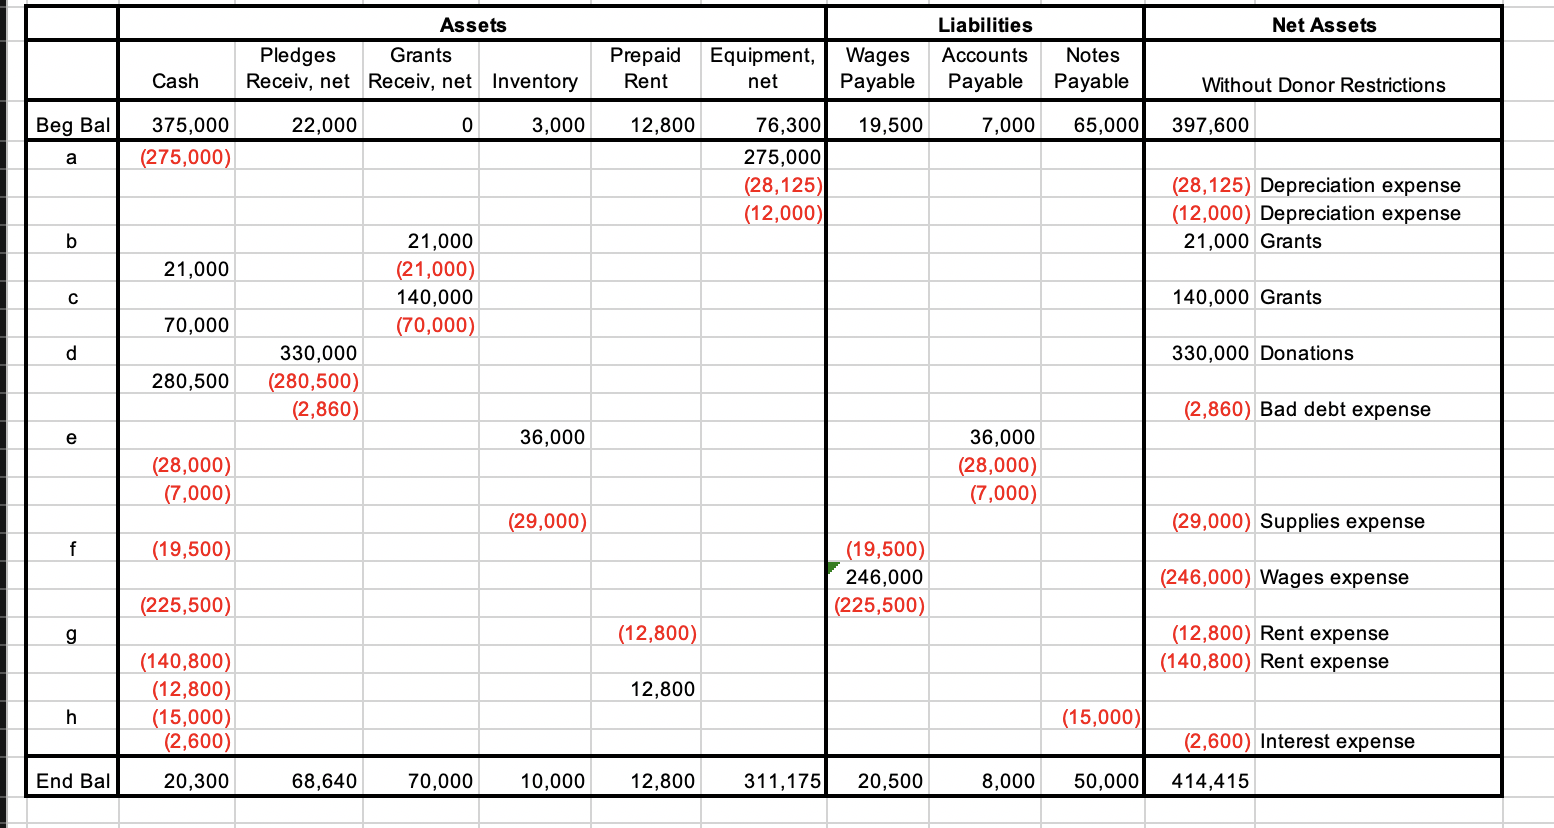
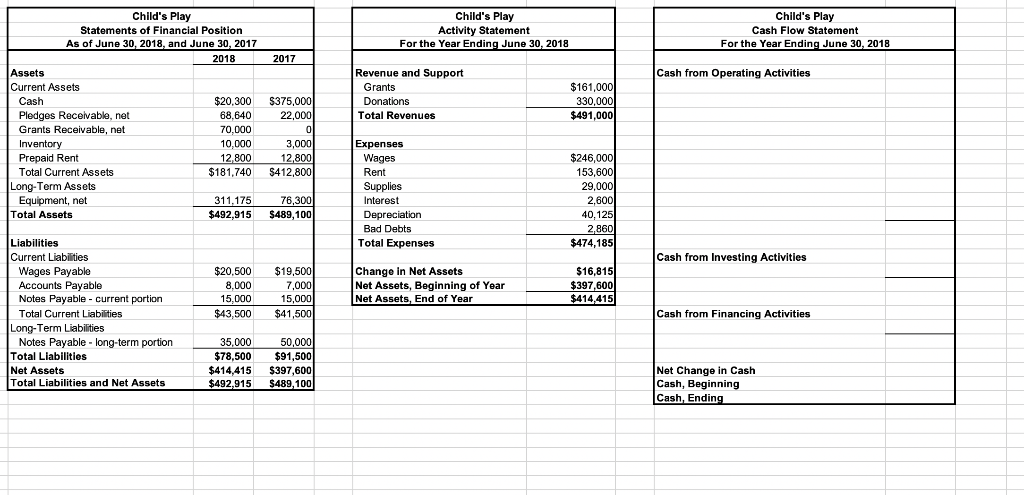
Net Assets Assets Pledges Grants Receiv, net Receiv, net Inventory Prepaid Rent Equipment, net Wages Payable Liabilities Accounts Payable Notes Payable Cash Without Donor Restrictions Beg Bal 22,000 0 3,000 12,800 19,500 7,000 65,000 397,600 375,000 (275,000) a 76,300 275,000 (28,125) (12,000) (28,125) Depreciation expense (12,000) Depreciation expense 21,000 Grants b 21,000 21,000 (21,000) 140,000 (70,000) 140,000 Grants 70,000 d 330,000 Donations 280,500 330,000 (280,500) (2,860) (2,860) Bad debt expense e 36,000 (28,000) (7,000) 36,000 (28,000) (7,000) (29,000) (29,000) Supplies expense f (19,500) (19,500) 246,000 (225,500) (246,000) Wages expense (225,500) g (12,800) (12,800) Rent expense (140,800) Rent expense 12,800 (140,800) (12,800) (15,000) (2,600) h (15,000) (2,600) Interest expense End Bal 20,300 68,640 70,000 10,000 12,800 311,175 20,500 8,000 50,000 414,415 Child's Play Activity Statement For the Year Ending June 30, 2018 Child's Play Cash Flow Statement For the Year Ending June 30, 2018 2017 Cash from Operating Activities Child's Play Statements of Financial Position As of June 30, 2018, and June 30, 2017 2018 Assets Current Assets Cash $20,300 Pledges Receivable, net 68,640 Grants Receivable, net 70,000 Inventory 10,000 Prepaid Rent 12,800 Total Current Assets $181,740 Long-Term Assets Equipment, net 311,175 Total Assets $492,915 Revenue and Support Grants Donations Total Revenues $161,000 330,000 $491,000 $375,000 22,000 0 3,000 12,800 $412,800 Expenses Wages Rent Supplies Interest Depreciation Bad Debts Total Expenses 76,300 $489,100 $246,000 153,600 29,000 2,600 40,125 2,860 $474,185 Cash from Investing Activities $20.500 8.000 15,000 $43,500 Liabilities Current Liabilities Wages Payable Accounts Payable Notes Payable - current portion Total Current Liabilities Long-Term Liabilities Notes Payable - long-term portion Total Liabilities Net Assets Total Liabilities and Net Assets $19,500 7,000 15,000 $41,500 Change in Net Assets Net Assets, Beginning of Year Net Assets. End of Year $16,815 $397,600 $414 415 Cash from Financing Activities 35,000 $78,500 $414,415 $492,915 50,000 $91,500 $397,600 $489,100 Net Change in Cash Cash, Beginning Cash, Ending