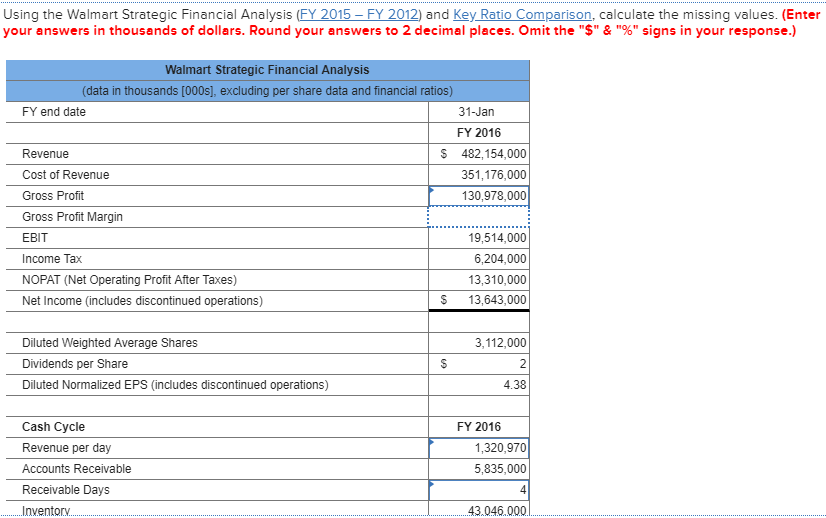
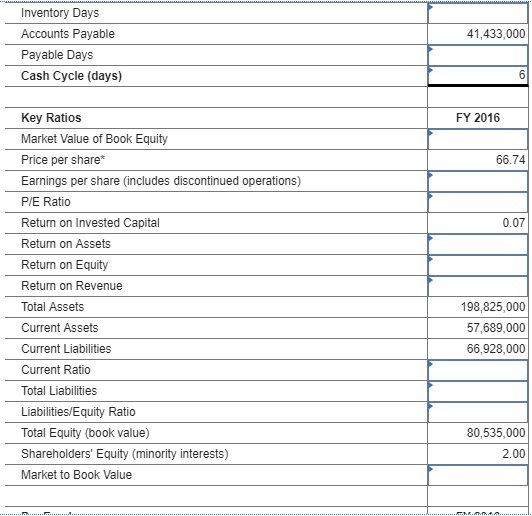
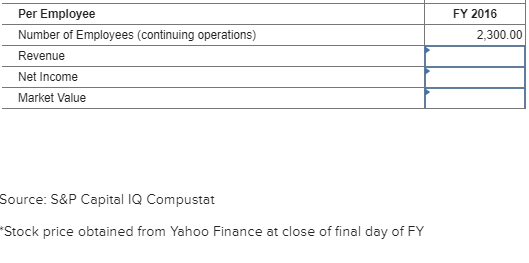
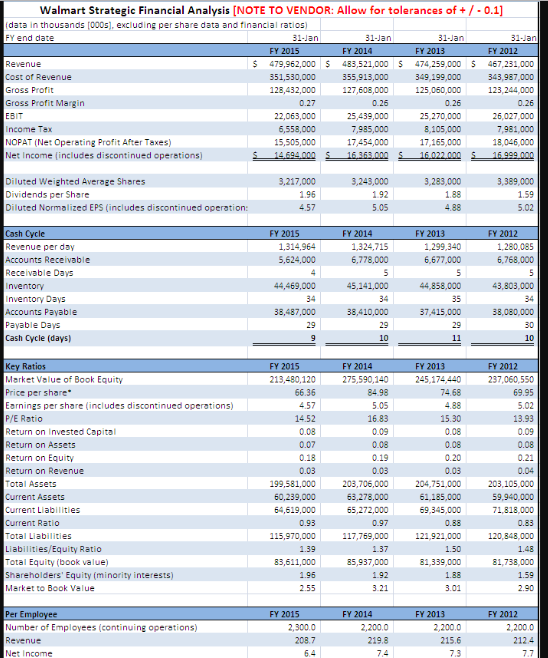
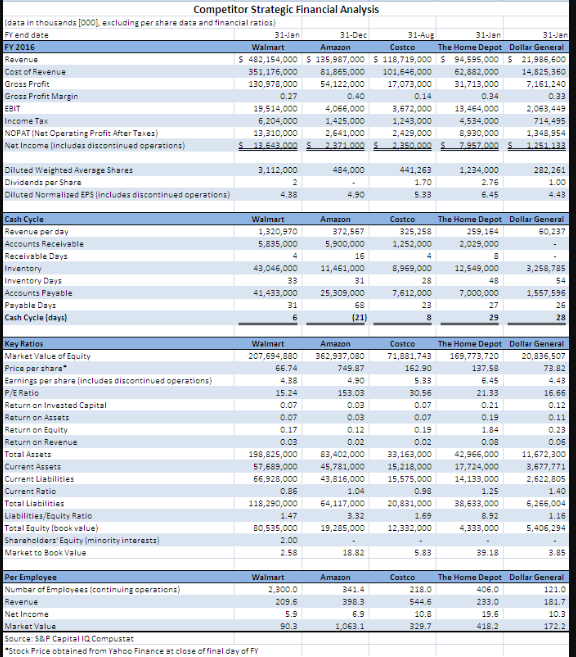
Using the Walmart Strategic Financial Analysis (FY 2015- FY 2012) and Key Ratio Comparison, calculate the missing values. (Enter your answers in thousands of dollars. Round your answers to 2 decimal places. Omit the "S" & "%" signs in your response.) Euranswerstowandelplaces Omitthe"S" & %" signs i Walmart Strategic Financial Analysis (data in thousands [000s], excluding per share data and financial ratios) FY end date 31-Jan FY 2016 Revenue Cost of Revenue Gross Profit Gross Profit Margin EBIT Income Tax NOPAT (Net Operating Profit After Taxes) Net Income (includes discontinued operations) S 482,154,000 351,176,000 130,978,000 19,514,000 6,204,000 13,310,000 S 13,643,000 Diluted Weighted Average Shares Dividends per Share Diluted Normalized EPS (includes discontinued operations) 3,112,000 4.38 Cash Cycle Revenue per day Accounts Receivable Receivable Days Inventory FY 2016 1,320,970 5,835,000 43.046.000 FY 2016 Per Employee Number of Employees (continuing operations) Revenue Net Income Market Value 2,300.00 Source: S&P Capital IQ Compustat Stock price obtained from Yahoo Finance at close of final day of FY Walmart Strategie Financil Analysis [NOTE TO VENDOR: Allow for tolerances of+-0.1] data in thousands [0005], excluding per share data and financial ratios) FY end date FY FY 2014 FY 2013 FY 479,962,000$ 483,521,000 $474 259,000 $ 467,231,000 Revenue Cost of Revenue Gross Profit Gross Profit Margin 351,530,000 355,913,000 349,199,000 343,987,000 128,432,000 127,608,000 125,060,000 123,244,000 22,063,000 6,558,000 15,505,000 25,439,000 7,985,000 17454,000 25,270,000 8,105,000 17,165,000 26,027,000 7,981,000 18,046,000 NOPAT (Net Operating Profit After Taxes) Net Income (includes discontinued operetions) 1642 Diluted Weighted Average Shares Dividends per Share Diluted Normalized EPS (includes discontinued operation: 3,217,000 3,243,000 3,283,000 3,389,000 5.05 5.02 Y 201 FY 2012 Revenue per day Accounts Receivable Receivable Days 1,280,085 6,768,000 5,624,000 44,469,000 38,487,000 6,778,000 6,677,000 44,858,000 43,803,000 34 38,080,000 Inventory Days Accounts Payable Payable Days Cash Cycle (days) 38,410,000 29 37,415,000 29 FY 2014 275,590,140 FY 2013 FY 2015 213,480,120 FY 2012 45,174 440 Merket Velue of Book Equity Price per share Earnings per share (includes discontinued operations P/E Ratio Return on Invested Copital Return on Assets Return on Equity Return on Revenue Total Assets Current Assets Current Liabilities Current Ratio 237,060,550 4.57 0.08 0.08 0.08 0.08 0.03 99,581,000 203,706,000 60,239,000 6,619,000 0.03 204,751,000 61,185,000 69,345,000 203,105,000 59,940,000 71,818,000 otal Liabilities Liabilities/Equity Ratio Total Equity (book value) Shareholders' Equity (minority interests) Market to Book Velue 115,970,000 117,769,000 83,611,000 85,937,000 81,339,000 81,738,000 FY 2015 FY 2014 FY 2013 FY 2012 Number of Employees (continuing operations) Revenue 2,300.0 2,200.0