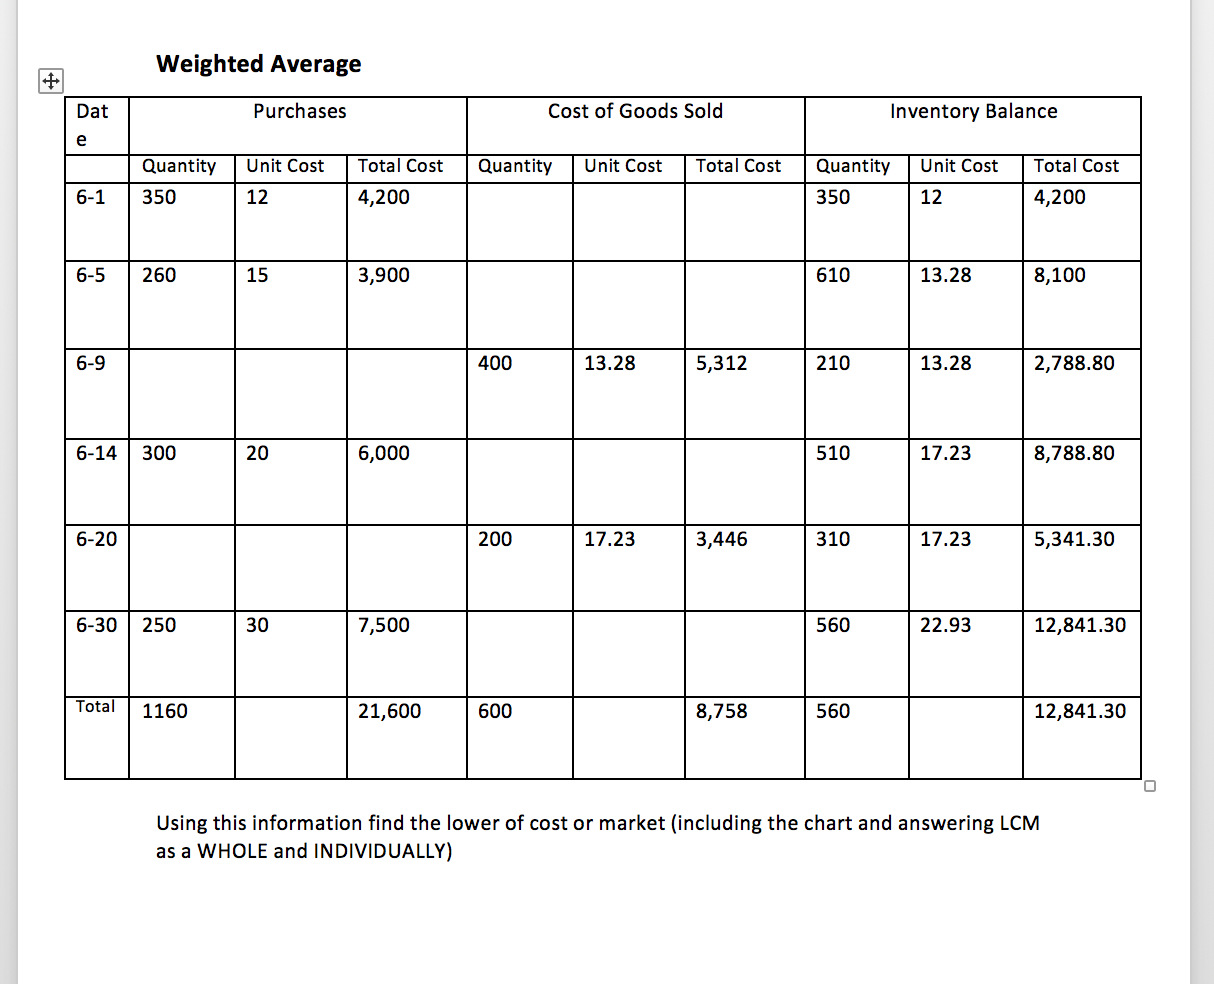
 Using this information find the lower of cost or market (including the chart and answering LCM as a WHOLE and INDIVIDUALLY)
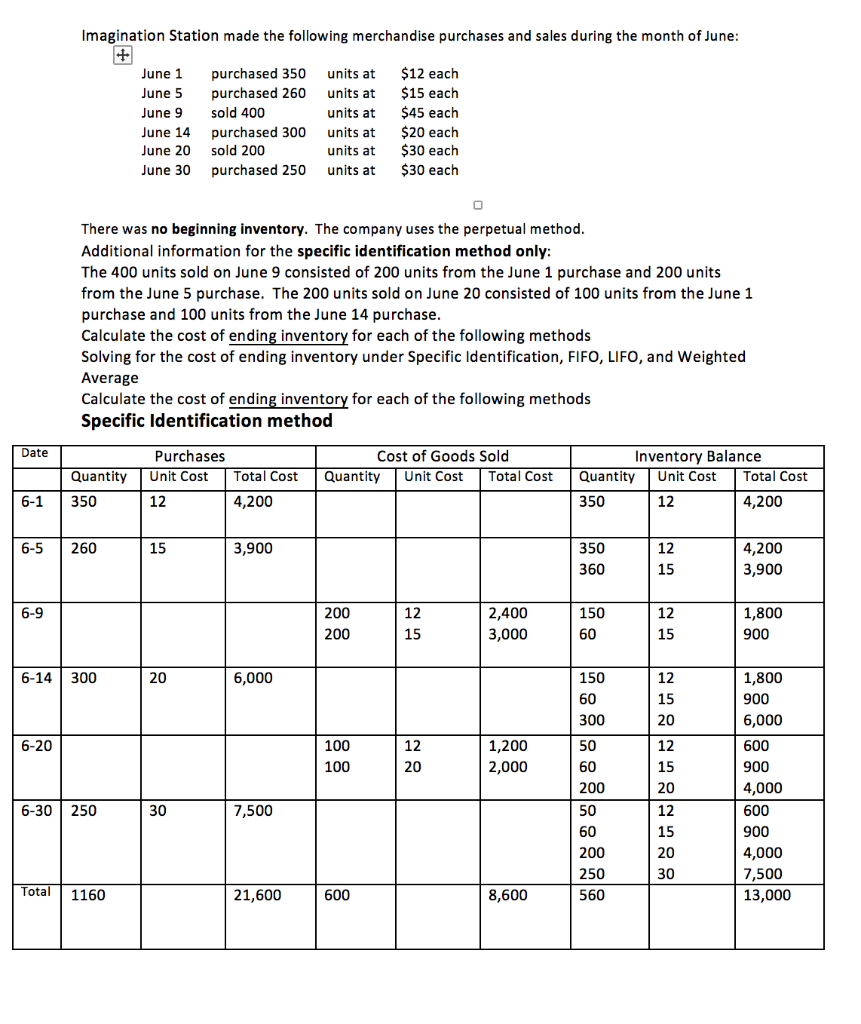
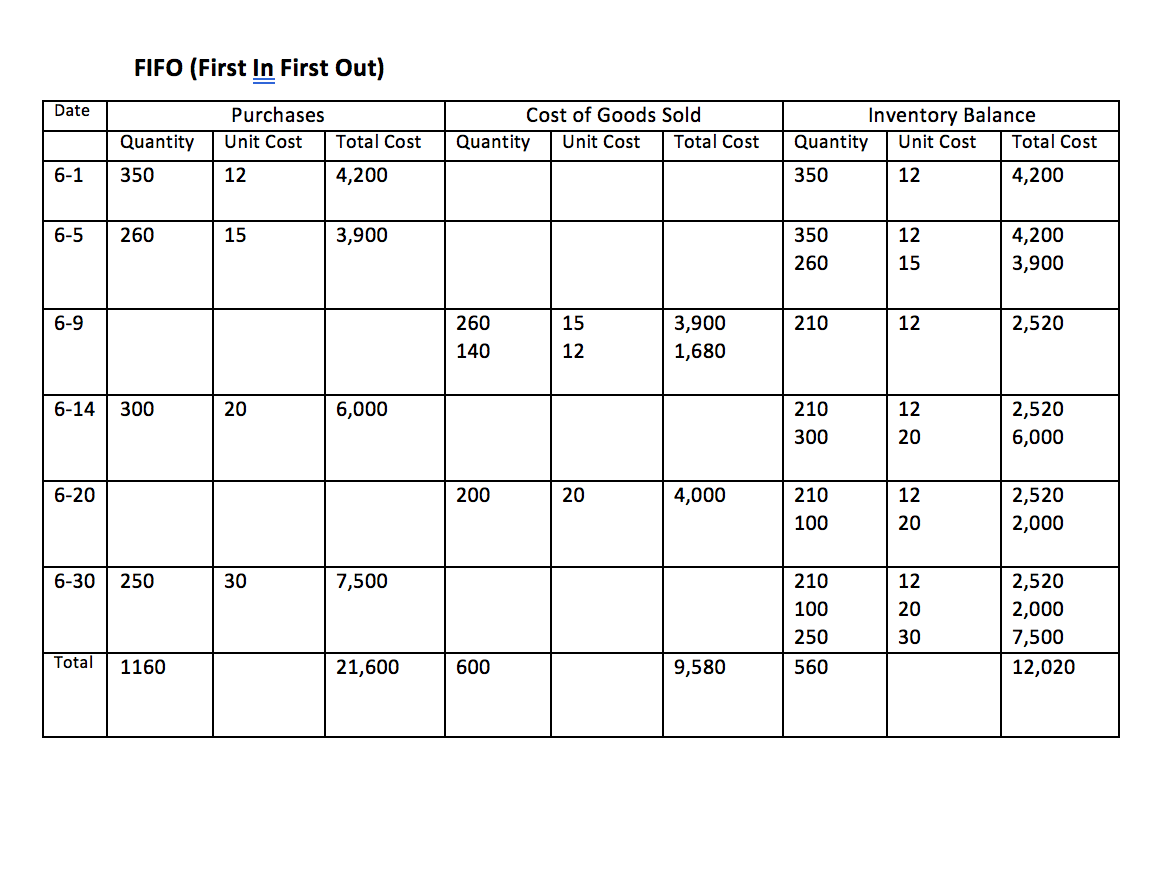
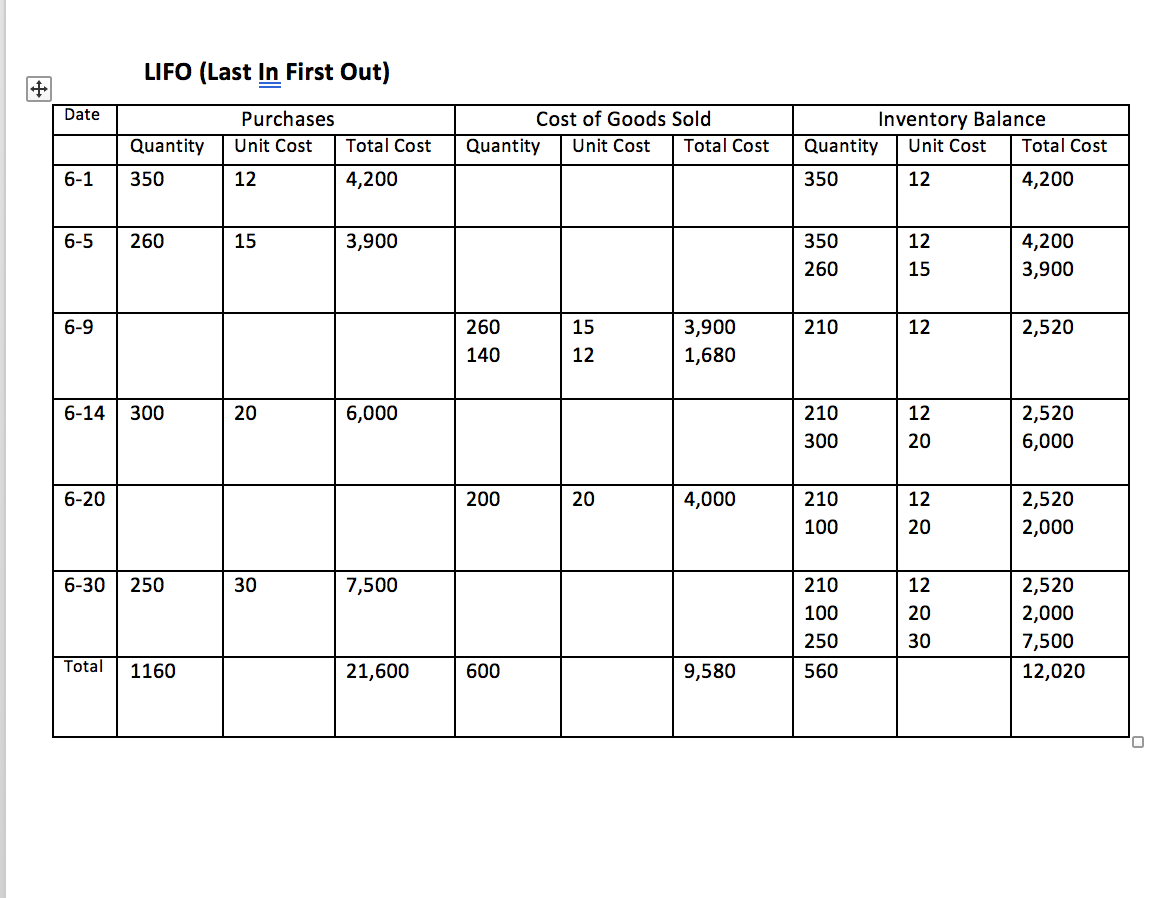
Imagination Station made the following merchandise purchases and sales during the month of June: June 1 June 5 June 9 June 14 June 20 June 30 purchased 350 purchased 260 sold 400 purchased 300 sold 200 purchased 250 units at units at units at units at units at units at $12 each $15 each $45 each $20 each $30 each $30 each There was no beginning inventory. The company uses the perpetual method. Additional information for the specific identification method only: The 400 units sold on June 9 consisted of 200 units from the June 1 purchase and 200 units from the June 5 purchase. The 200 units sold on June 20 consisted of 100 units from the June 1 purchase and 100 units from the June 14 purchase. Calculate the cost of ending inventory for each of the following methods Solving for the cost of ending inventory under Specific Identification, FIFO, LIFO, and Weighted Average Calculate the cost of ending inventory for each of the following methods Specific Identification method Date Purchases Unit Cost Total Cost Cost of Goods Sold Quantity Unit Cost Total Cost Quantity Inventory Balance Quantity Unit Cost Total Cost 350 12 4,200 6-1 350 12 4,200 6-5 260 15 3,900 350 360 12 15 4,200 3,900 6-9 200 200 12 15 2,400 3,000 150 60 12 15 1,800 900 6-14 300 20 6,000 150 60 300 12 15 20 6-20 12 100 100 1,200 2,000 20 50 60 200 50 60 1,800 900 6,000 600 900 4,000 600 900 4,000 7,500 13,000 6-30 250 30 12 15 20 12 15 20 30 7,500 200 250 560 Total 1160 21,600 600 8,600 FIFO (First In First Out) Date Purchases Unit Cost Cost of Goods Sold Quantity Unit Cost Total Cost Inventory Balance Quantity Unit Cost Total Cost Total Cost Quantity 350 6-1 12 4,200 350 12 4,200 6-5 260 15 3,900 350 260 12 15 4,200 3,900 6-9 3,900 210 12 2,520 260 140 15 12 1,680 6-14 300 20 6,000 210 300 12 20 2,520 6,000 6-20 200 20 4,000 210 100 12 20 2,520 2,000 6-30 250 30 7,500 12 20 210 100 250 560 2,520 2,000 7,500 12,020 30 Total 1160 21,600 600 9,580 LIFO (Last In First Out) Date Purchases Unit Cost Cost of Goods Sold Quantity Unit Cost Total Cost Total Cost Quantity 350 Inventory Balance Quantity Unit Cost Total Cost 350 12 4,200 6-1 12 4,200 6-5 260 15 3,900 350 260 12 15 4,200 3,900 6-9 15 210 12 2,520 260 140 3,900 1,680 12 6-14 300 20 6,000 210 300 12 20 2,520 6,000 6-20 200 20 4,000 210 100 12 20 2,520 2,000 6-30 250 30 7,500 210 100 250 12 20 30 2,520 2,000 7,500 12,020 Total 1160 21,600 600 9,580 560 0 Weighted Average Dat Purchases Cost of Goods Sold Inventory Balance e Unit Cost Total Cost Quantity Unit Cost Total Cost Unit Cost Total Cost Quantity 350 Quantity 350 6-1 12 4,200 12 4,200 6-5 260 15 3,900 610 13.28 8,100 6-9 400 13.28 5,312 210 13.28 2,788.80 6-14 300 20 6,000 510 17.23 8,788.80 6-20 200 17.23 3,446 310 17.23 5,341.30 6-30 250 30 7,500 560 22.93 12,841.30 Total 1160 21,600 600 8,758 560 12,841.30 Using this information find the lower of cost or market (including the chart and answering LCM as a WHOLE and INDIVIDUALLY) Imagination Station made the following merchandise purchases and sales during the month of June: June 1 June 5 June 9 June 14 June 20 June 30 purchased 350 purchased 260 sold 400 purchased 300 sold 200 purchased 250 units at units at units at units at units at units at $12 each $15 each $45 each $20 each $30 each $30 each There was no beginning inventory. The company uses the perpetual method. Additional information for the specific identification method only: The 400 units sold on June 9 consisted of 200 units from the June 1 purchase and 200 units from the June 5 purchase. The 200 units sold on June 20 consisted of 100 units from the June 1 purchase and 100 units from the June 14 purchase. Calculate the cost of ending inventory for each of the following methods Solving for the cost of ending inventory under Specific Identification, FIFO, LIFO, and Weighted Average Calculate the cost of ending inventory for each of the following methods Specific Identification method Date Purchases Unit Cost Total Cost Cost of Goods Sold Quantity Unit Cost Total Cost Quantity Inventory Balance Quantity Unit Cost Total Cost 350 12 4,200 6-1 350 12 4,200 6-5 260 15 3,900 350 360 12 15 4,200 3,900 6-9 200 200 12 15 2,400 3,000 150 60 12 15 1,800 900 6-14 300 20 6,000 150 60 300 12 15 20 6-20 12 100 100 1,200 2,000 20 50 60 200 50 60 1,800 900 6,000 600 900 4,000 600 900 4,000 7,500 13,000 6-30 250 30 12 15 20 12 15 20 30 7,500 200 250 560 Total 1160 21,600 600 8,600 FIFO (First In First Out) Date Purchases Unit Cost Cost of Goods Sold Quantity Unit Cost Total Cost Inventory Balance Quantity Unit Cost Total Cost Total Cost Quantity 350 6-1 12 4,200 350 12 4,200 6-5 260 15 3,900 350 260 12 15 4,200 3,900 6-9 3,900 210 12 2,520 260 140 15 12 1,680 6-14 300 20 6,000 210 300 12 20 2,520 6,000 6-20 200 20 4,000 210 100 12 20 2,520 2,000 6-30 250 30 7,500 12 20 210 100 250 560 2,520 2,000 7,500 12,020 30 Total 1160 21,600 600 9,580 LIFO (Last In First Out) Date Purchases Unit Cost Cost of Goods Sold Quantity Unit Cost Total Cost Total Cost Quantity 350 Inventory Balance Quantity Unit Cost Total Cost 350 12 4,200 6-1 12 4,200 6-5 260 15 3,900 350 260 12 15 4,200 3,900 6-9 15 210 12 2,520 260 140 3,900 1,680 12 6-14 300 20 6,000 210 300 12 20 2,520 6,000 6-20 200 20 4,000 210 100 12 20 2,520 2,000 6-30 250 30 7,500 210 100 250 12 20 30 2,520 2,000 7,500 12,020 Total 1160 21,600 600 9,580 560 0 Weighted Average Dat Purchases Cost of Goods Sold Inventory Balance e Unit Cost Total Cost Quantity Unit Cost Total Cost Unit Cost Total Cost Quantity 350 Quantity 350 6-1 12 4,200 12 4,200 6-5 260 15 3,900 610 13.28 8,100 6-9 400 13.28 5,312 210 13.28 2,788.80 6-14 300 20 6,000 510 17.23 8,788.80 6-20 200 17.23 3,446 310 17.23 5,341.30 6-30 250 30 7,500 560 22.93 12,841.30 Total 1160 21,600 600 8,758 560 12,841.30 Using this information find the lower of cost or market (including the chart and answering LCM as a WHOLE and INDIVIDUALLY)