

Question
Using Turtle Graphics in Python you need to re-create this star system. Every coordinate for this system is located at http:/ifty.stanford.edu/2009/reid-starmap/stars.txt The fields that you
Using Turtle Graphics in Python you need to re-create this star system.
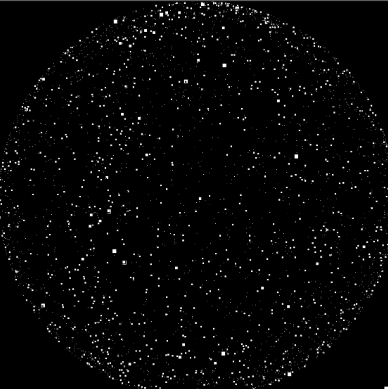
Every coordinate for this system is located at http:/ifty.stanford.edu/2009/reid-starmap/stars.txt
The fields that you will need for this assignment include the x and y coordinates, the magnitude, the Henry Draper number, and the name (or names) of each star.
There are three functions that you should use.
read_coords(file)
Given an open text file that contains a star catalog as specified above, return three dictionaries using a tuple. The first is keyed on the Henry Draper number and the values are tuples containing the x and y coordinates of each star. The second dictionary is also keyed on the Henry Draper numbers and contains the magnitudes (float) of the stars. The third dictionary is keyed on the names of the stars and the values are the Henry Draper numbers. If a star has more than one name, each name will appear as a key in the third dictionary. If a star does not have a name it will not be represented in the third dictionary. HINTS: (1) You can return multiple dictionaries by using a tuple. (2) Star names may contain spaces, thus they are separated using semicolons.
plot_plain_stars(picture_size, coordinates_dict)
Given the size of the the picture in pixels, and a dictionary containing the x,y coordinates of stars as values in the dictionary, plot the stars and have turtle draw the picture. Be sure to map the coordinate values (i.e., -1 to 1) approproiately based on the picture size you plan to use. The middle of the picture is considered (0,0). If you plot x,y values without an appropriate value all starts will appear in the very middle of the screeen. Set the picture background to black. The stars are plotted as 2x2 pixel white-filled rectangles. (The fillcolor() function in the turtle module will help you out.) This funcion is to help you get started and it will be replaced with the plot_by_magnitude function below.
plot_by_magnitude(picture_size, coordinates_dict, magnitudes_dict)
Given a the size of the the picture in pixels, a dictionary containing the x,y coordinates, and a dictionary containing the magnitudes, plot the stars and have turtle draw the picture. Set the picture background to black. In this case the stars are plotted as white-filled rectangles, but the size of the rectangle is a function of the magnitude of the stars. Since brighter stars have smaller magnitude values, you will calculate the size of the rectangle as follows: star_size = round(10.0 /(magnitude +2)). Limit the size of the star to 8 pixels or the scaled value whichever is smaller.
Step by Step Solution
There are 3 Steps involved in it
Step: 1

Get Instant Access to Expert-Tailored Solutions
See step-by-step solutions with expert insights and AI powered tools for academic success
Step: 2

Step: 3
Ace Your Homework with AI
Get the answers you need in no time with our AI-driven, step-by-step assistance
Get Started
Database Administrator Limited Edition
Authors: Martif Way
1st Edition
B0CGG89N8Z