Answered step by step
Verified Expert Solution
Question
1 Approved Answer
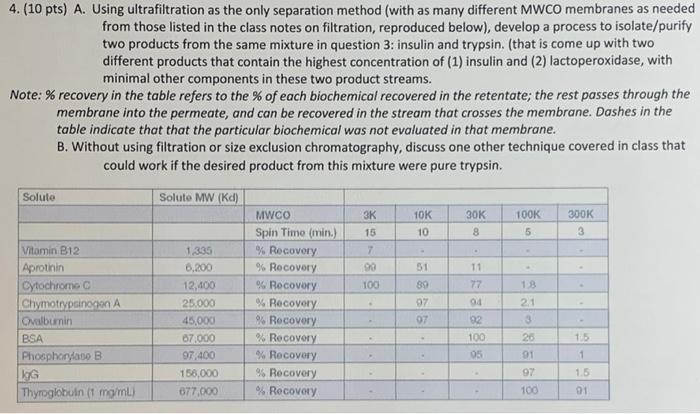
Using ultrafiltration as the only separation method, develop a process to isolate/purify two products from the same mixture in question 3: insulin & trypsin. Please
Using ultrafiltration as the only separation method, develop a process to isolate/purify two products from the same mixture in question 3: insulin & trypsin. 

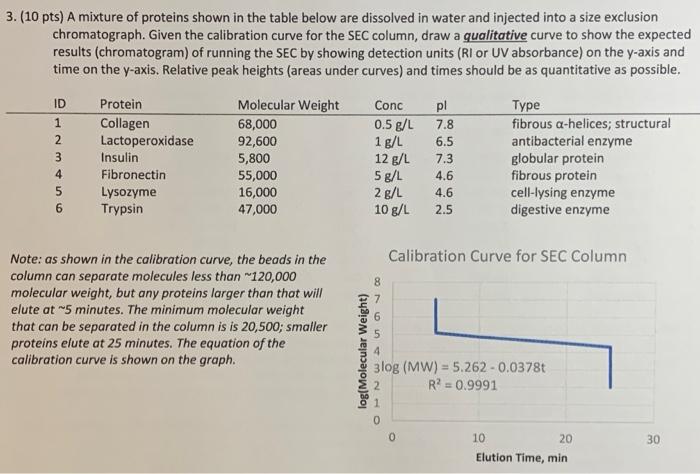
4. (10 pts) A. Using ultrafiltration as the only separation method (with as many different MWCO membranes as needed from those listed in the class notes on filtration, reproduced below), develop a process to isolate/purify two products from the same mixture in question 3: insulin and trypsin. (that is come up with two different products that contain the highest concentration of (1) insulin and (2) lactoperoxidase, with minimal other components in these two product streams. Note: % recovery in the table refers to the % of each biochemical recovered in the retentate; the rest passes through the membrane into the permeate, and can be recovered in the stream that crosses the membrane. Dashes in the table indicate that that the particular biochemical was not evaluated in that membrane. B. Without using filtration or size exclusion chromatography, discuss one other technique covered in class that could work if the desired product from this mixture were pure trypsin. Solute Solute MW (K) 3K 10K 10 30K 8 100K 5 300K 3 15 7 90 100 51 Vitamin B12 Aprotinin Cytochrome Chymotrypsinogen A Cualbumin BSA Phosphorylas B KG Thyroglobuin (1 mgml) 1.335 0,200 12,400 25.000 45,000 67.000 97,400 158,000 077,000 MWCO Spin Timo (min.) % Recovery % Recovery % Recovery % Recovery 9 Recovery % Recovery % Recovery % Recovery % Recovery 89 97 07 11 77 04 92 100 05 18 21 3 20 91 97 100 15 1 1.5 91 3. (10 pts) A mixture of proteins shown in the table below are dissolved in water and injected into a size exclusion chromatograph. Given the calibration curve for the SEC column, draw a qualitative curve to show the expected results (chromatogram) of running the SEC by showing detection units (RI or UV absorbance) on the y-axis and time on the y-axis. Relative peak heights (areas under curves) and times should be as quantitative as possible. ID 1 2 3 4 5 6 Protein Collagen Lactoperoxidase Insulin Fibronectin Lysozyme Trypsin Molecular Weight 68,000 92,600 5,800 55,000 16,000 47,000 Conc 0.5 g/L 1 g/L 12 g/L 5 g/L 2 g/L 10 g/L pl 7.8 6.5 7.3 4.6 4.6 2.5 Type fibrous a-helices; structural antibacterial enzyme globular protein fibrous protein cell-lysing enzyme digestive enzyme Calibration Curve for SEC Column 8 Note: as shown in the calibration curve, the beads in the column can separate molecules less than 120,000 molecular weight, but any proteins larger than that will elute at 5 minutes. The minimum molecular weight that can be separated in the column is is 20,500; smaller proteins elute at 25 minutes. The equation of the calibration curve is shown on the graph. log(Molecular Weight) No CONNO 4 Blog (MW) = 5.262 -0.0378t 2 R? = 0.9991 0 30 10 20 Elution Time, min Please answer question #4 parts A & B.
I have provided a photo of question 3 to help you solve question 4.


Step by Step Solution
There are 3 Steps involved in it
Step: 1

Get Instant Access to Expert-Tailored Solutions
See step-by-step solutions with expert insights and AI powered tools for academic success
Step: 2

Step: 3

Ace Your Homework with AI
Get the answers you need in no time with our AI-driven, step-by-step assistance
Get Started


