Using Verizon and Comcast, determine the free cash flow from 2016 and 2017. What inference can you draw from the companies free cash flow? Using the 2018 and 2019 financial statements for both stocks, prepare two financial ratios for each of the following categories: liquidity ratios, asset management ratios, and profitability ratios. You should have a total of six ratios for each stock, per year. What challenges, strengths, or weaknesses do you see?
Having some trouble with this one, any help will do. Thanks!
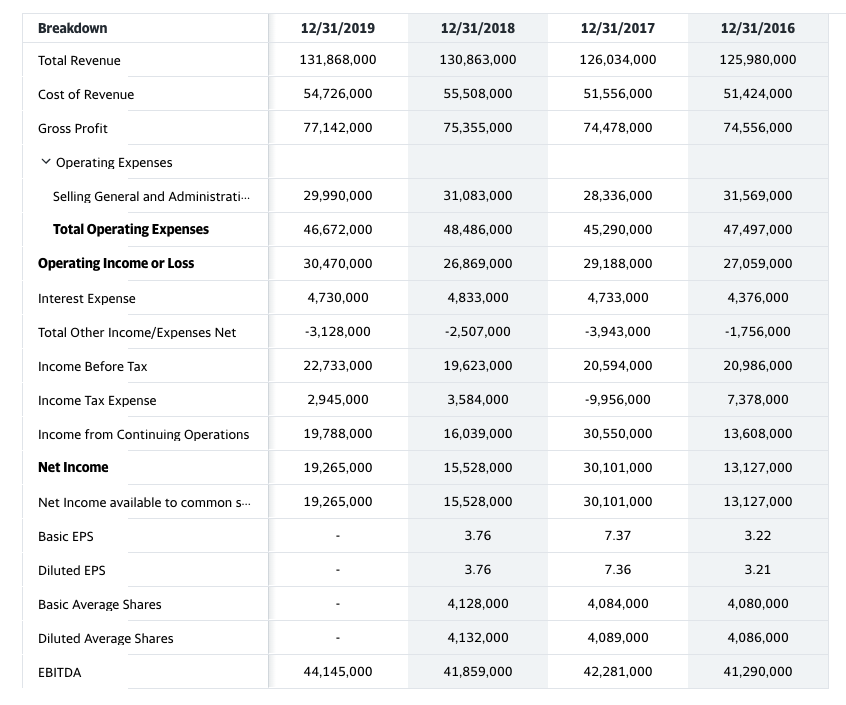
Verizon
Comcast
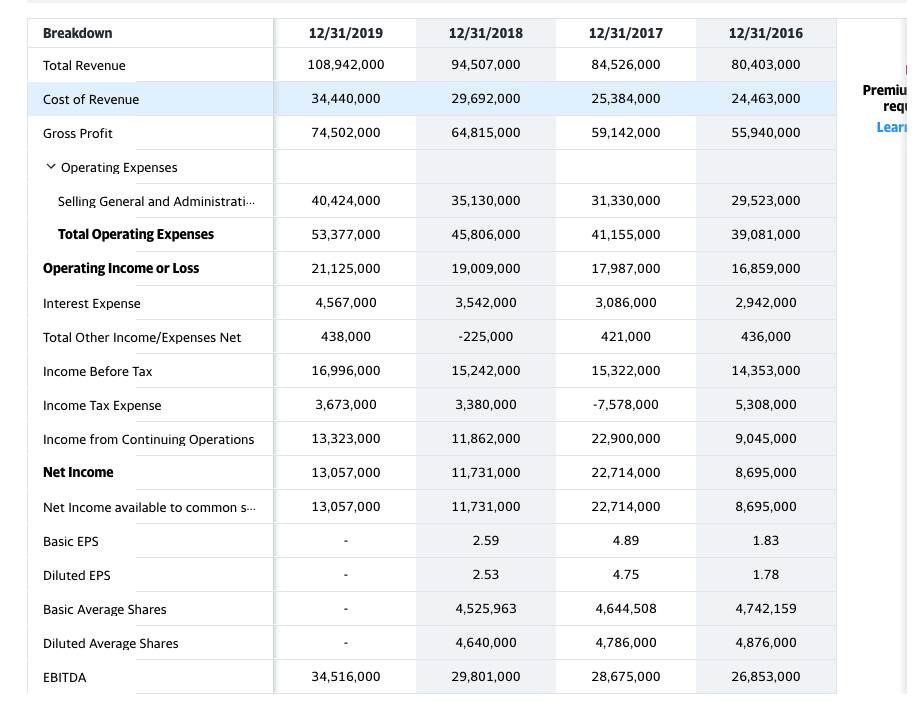
Breakdown 12/31/2019 12/31/2018 12/31/2017 12/31/2016 Total Revenue 131,868,000 130,863,000 126,034,000 125,980,000 Cost of Revenue 54,726,000 55,508,000 51,556,000 51,424,000 Gross Profit 77,142,000 75,355,000 74,478,000 74,556,000 Operating Expenses Selling General and Administrati... 29,990,000 31,083,000 28,336,000 31,569,000 Total Operating Expenses 46,672,000 48,486,000 45,290,000 47,497,000 Operating Income or Loss 30,470,000 26,869,000 29,188,000 27,059,000 Interest Expense 4,730,000 4,833,000 4,733,000 4,376,000 Total Other Income/Expenses Net -3,128,000 -2,507,000 -3,943,000 -1,756,000 Income Before Tax 22,733,000 19,623,000 20,594,000 20,986,000 Income Tax Expense 2,945,000 3,584,000 -9,956,000 7,378,000 Income from Continuing Operations 19,788,000 16,039,000 30,550,000 13,608,000 Net Income 19,265,000 15,528,000 30,101,000 13,127,000 Net Income available to common S... 19,265,000 15,528,000 30,101,000 13,127,000 Basic EPS 3.76 7.37 3.22 Diluted EPS 3.76 7.36 3.21 Basic Average Shares 4,128,000 4,084,000 4,080,000 Diluted Average Shares 4,132,000 4,089,000 4,086,000 EBITDA 44,145,000 41,859,000 42,281,000 41,290,000 Breakdown 12/31/2018 12/31/2017 12/31/2016 12/31/2019 108,942,000 Total Revenue 94,507,000 84,526,000 80,403,000 Cost of Revenue 34,440,000 29,692,000 25,384,000 24,463,000 Premiu reqi Leari Gross Profit 74,502,000 64,815,000 59,142,000 55,940,000 Operating Expenses Selling General and Administrati... 40,424,000 35,130,000 31,330,000 29,523,000 Total Operating Expenses 53,377,000 45,806,000 41,155,000 39,081,000 Operating Income or Loss 21,125,000 19,009,000 17,987,000 16,859,000 Interest Expense 4,567,000 3,542,000 3,086,000 2,942,000 Total Other Income/Expenses Net 438,000 -225,000 421,000 436,000 Income Before Tax 16,996,000 15,242,000 15,322,000 14,353,000 Income Tax Expense 3,673,000 3,380,000 -7,578,000 5,308,000 Income from Continuing Operations 13,323,000 11,862,000 22,900,000 9,045,000 Net Income 13,057,000 11,731,000 22,714,000 8,695,000 Net Income available to common S... 13,057,000 11,731,000 22,714,000 8,695,000 Basic EPS 2.59 4.89 1.83 Diluted EPS 2.53 4.75 1.78 Basic Average Shares 4,525,963 4,644,508 4,742,159 Diluted Average Shares 4,640,000 4,786,000 4,876,000 EBITDA 34,516,000 29,801,000 28,675,000 26,853,000 Breakdown 12/31/2019 12/31/2018 12/31/2017 12/31/2016 Total Revenue 131,868,000 130,863,000 126,034,000 125,980,000 Cost of Revenue 54,726,000 55,508,000 51,556,000 51,424,000 Gross Profit 77,142,000 75,355,000 74,478,000 74,556,000 Operating Expenses Selling General and Administrati... 29,990,000 31,083,000 28,336,000 31,569,000 Total Operating Expenses 46,672,000 48,486,000 45,290,000 47,497,000 Operating Income or Loss 30,470,000 26,869,000 29,188,000 27,059,000 Interest Expense 4,730,000 4,833,000 4,733,000 4,376,000 Total Other Income/Expenses Net -3,128,000 -2,507,000 -3,943,000 -1,756,000 Income Before Tax 22,733,000 19,623,000 20,594,000 20,986,000 Income Tax Expense 2,945,000 3,584,000 -9,956,000 7,378,000 Income from Continuing Operations 19,788,000 16,039,000 30,550,000 13,608,000 Net Income 19,265,000 15,528,000 30,101,000 13,127,000 Net Income available to common S... 19,265,000 15,528,000 30,101,000 13,127,000 Basic EPS 3.76 7.37 3.22 Diluted EPS 3.76 7.36 3.21 Basic Average Shares 4,128,000 4,084,000 4,080,000 Diluted Average Shares 4,132,000 4,089,000 4,086,000 EBITDA 44,145,000 41,859,000 42,281,000 41,290,000 Breakdown 12/31/2018 12/31/2017 12/31/2016 12/31/2019 108,942,000 Total Revenue 94,507,000 84,526,000 80,403,000 Cost of Revenue 34,440,000 29,692,000 25,384,000 24,463,000 Premiu reqi Leari Gross Profit 74,502,000 64,815,000 59,142,000 55,940,000 Operating Expenses Selling General and Administrati... 40,424,000 35,130,000 31,330,000 29,523,000 Total Operating Expenses 53,377,000 45,806,000 41,155,000 39,081,000 Operating Income or Loss 21,125,000 19,009,000 17,987,000 16,859,000 Interest Expense 4,567,000 3,542,000 3,086,000 2,942,000 Total Other Income/Expenses Net 438,000 -225,000 421,000 436,000 Income Before Tax 16,996,000 15,242,000 15,322,000 14,353,000 Income Tax Expense 3,673,000 3,380,000 -7,578,000 5,308,000 Income from Continuing Operations 13,323,000 11,862,000 22,900,000 9,045,000 Net Income 13,057,000 11,731,000 22,714,000 8,695,000 Net Income available to common S... 13,057,000 11,731,000 22,714,000 8,695,000 Basic EPS 2.59 4.89 1.83 Diluted EPS 2.53 4.75 1.78 Basic Average Shares 4,525,963 4,644,508 4,742,159 Diluted Average Shares 4,640,000 4,786,000 4,876,000 EBITDA 34,516,000 29,801,000 28,675,000 26,853,000