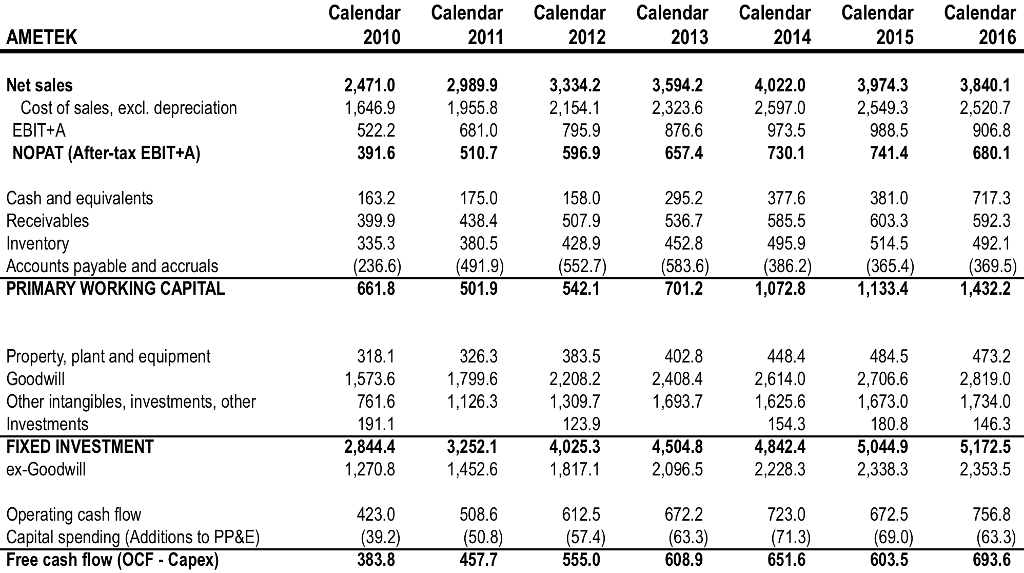
-Using your balance sheet activity formulas, what were accounts receivable turns in 2016?
-Which balance sheet account had the greatest increase, in dollar terms, between 2010-2016?
| | |
| | | 2) | Other intangibles, investments, other | |
| | | 3) | Property, plant and equipment | |
| | |
-What was free cash flow/revenue (FCF/Net Sales) in 2010? 2016?
Calendar Calendar Calendar Calendar Calendar Calendar Calendar 2016 AMETEK 2010 2011 2012 2013 2014 2015 4,022.0 2,597.0 973.5 730.1 2,989.9 1,955.8 3,840.1 2,520.7 2,471.0 1,646.9 522.2 391.6 3,594.2 2,323.6 876.6 657.4 3,974.3 2,549.3 Net sales 3,334.2 2,154.1 596.9 158.0 428.9 Cost of sales, excl. depreciation EBIT+A NOPAT (After-tax EBIT+A) 510.7 680.1 Cash and equivalents Receivables Inventory Accounts payable and accruals PRIMARY WORKING CAPITAL 163.2 399.9 335.3 236.6) 295.2 536.7 452.8 377.6 585.5 495.9 (386.2) 1,072.8 592.3 492.1 (369.5) 1,432.2 603.3 380.5 (491.9) (552.7) 542.1 365.4) 1,133.4 Property, plant and equipment Goodwill Other intangibles, investments, other Investments FIXED INVESTMENT ex-Goodwill 402.8 2,408.4 1,693.7 473.2 2,819.0 1,734.0 146.3 5,172.5 2,353.5 326.3 1,799.6 1,126.3 2,208.2 1,309.7 123.9 4,025.3 2,706.6 1,673.0 180.8 5,044.9 2,338.3 1,573.6 2,614.0 1,625.6 191.1 2,8444 1,270.8 3,252.1 1,452.6 4,504.8 2,096.5 4,842.4 2,228.3 756.8 Operating cash flow Capital spending (Additions to PP&E) Free cash flow (OCF - Capex) 672.2 672.5 (57.4) 555.0 457.7 608.9 651.6 693.6


