

Question
Using your data from Chapter 6 project complete the following: 1)What is your parameter of interest? Parameter of interest is the height of 30 adults.
Using your data from Chapter 6 project complete the following:
1)What is your parameter of interest?
Parameter of interest is the height of 30 adults.
2)What is your population of interest?You must be specific about what group you are studying and when?
Population of interest is the height of people.
3)Give a detailed explanation of how your data may have been selected in your sample above?
a)What kind of sample will it be (Systematic, Cluster, Stratified or Random)?
The sample is classified as cluster since the height range is from 63.48115 to 71.51521 inches which is close enough and likely to be drawn from a group with similar characteristics.
b) What is the sample size? 30 people.
b)Determine a % confidence interval you will use to analyze this data set? (90%, 95%, or 99%) and why? (5pts) A 95% confidence interval can be used as it is the mostly used confidence level in many investigations.
4)Make sure you list your data set below:
Height(inches)
- 65.78331
- 71.51521
- 69.39874
- 68.2166
- 67.78781
- 68.69784
- 69.80204
- 70.01472
- 67.90265
- 66.78236
- 66.48769
- 67.62333
- 68.30248
- 67.11656
- 68.27967
- 71.0916
- 66.461
- 68.64927
- 71.23033
- 67.13118
- 67.83379
- 68.87881
- 63.48115
- 68.42187
- 67.62804
- 67.20864
- 70.84235
- 67.49434
- 66.53401
- 65.44098
5)Find the mean and standard deviation for the data set chosen. mean = 68.06795 inches, stdev = 1.805908 inches
Calculate the margin of error for your data sample, based upon the CI % chosen in #3c. Show all calculations. Margin of error, E, can be obtained from the formula
E = tcrit*(stdev/sqrt n)
At df = n-1 = 30-1 = 29 and a = 0.05, t crit = 2.0452
E = 2.0452*1.805908/s qrt 30
E = 0.67432
6)Calculate the confidence interval for your set of data based upon the CI % chosen in #3c. Show all calculations.
C.I. = mean +/- E
C.I. = 68.06795- 0.67432
C.I. = (67.39363, 68.74227)
7)State the written conclusion for the confidence interval found in #7.
95% confident that the true population mean height of adults are between67.39363 and 68.74227 inches.
8)Describe what this interval means in context. The true population mean height of adults lies between67.39363 and 68.74227 inches at 95% confidence level. If the hypothesized mean height of adults is within the interval, then the hypothesis then is true and conclude that the hypothesized mean height is not significantly different from the height gathered from the sample data.
All the questions above is already solved. That's all the info needed for the next few questions that i am confused with. I would be grateful with any help sent my way.
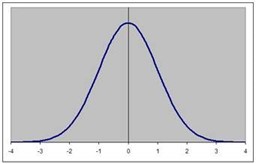
1)Label the confidence interval graph given below. Using insert-shapes draw the lines where the critical values should appear for the % chosen above. Indicate the critical values below the graph and label the area for the tails. Click on any line before the graph on the left and space over to record the data on the graph.
Step by Step Solution
There are 3 Steps involved in it
Step: 1

Get Instant Access to Expert-Tailored Solutions
See step-by-step solutions with expert insights and AI powered tools for academic success
Step: 2

Step: 3
Ace Your Homework with AI
Get the answers you need in no time with our AI-driven, step-by-step assistance
Get Started
Linear Algebra With Applications
Authors: Jeffrey Holt
2nd Edition
1319057691, 9781319057695