

Answered step by step
Verified Expert Solution
Question
1 Approved Answer
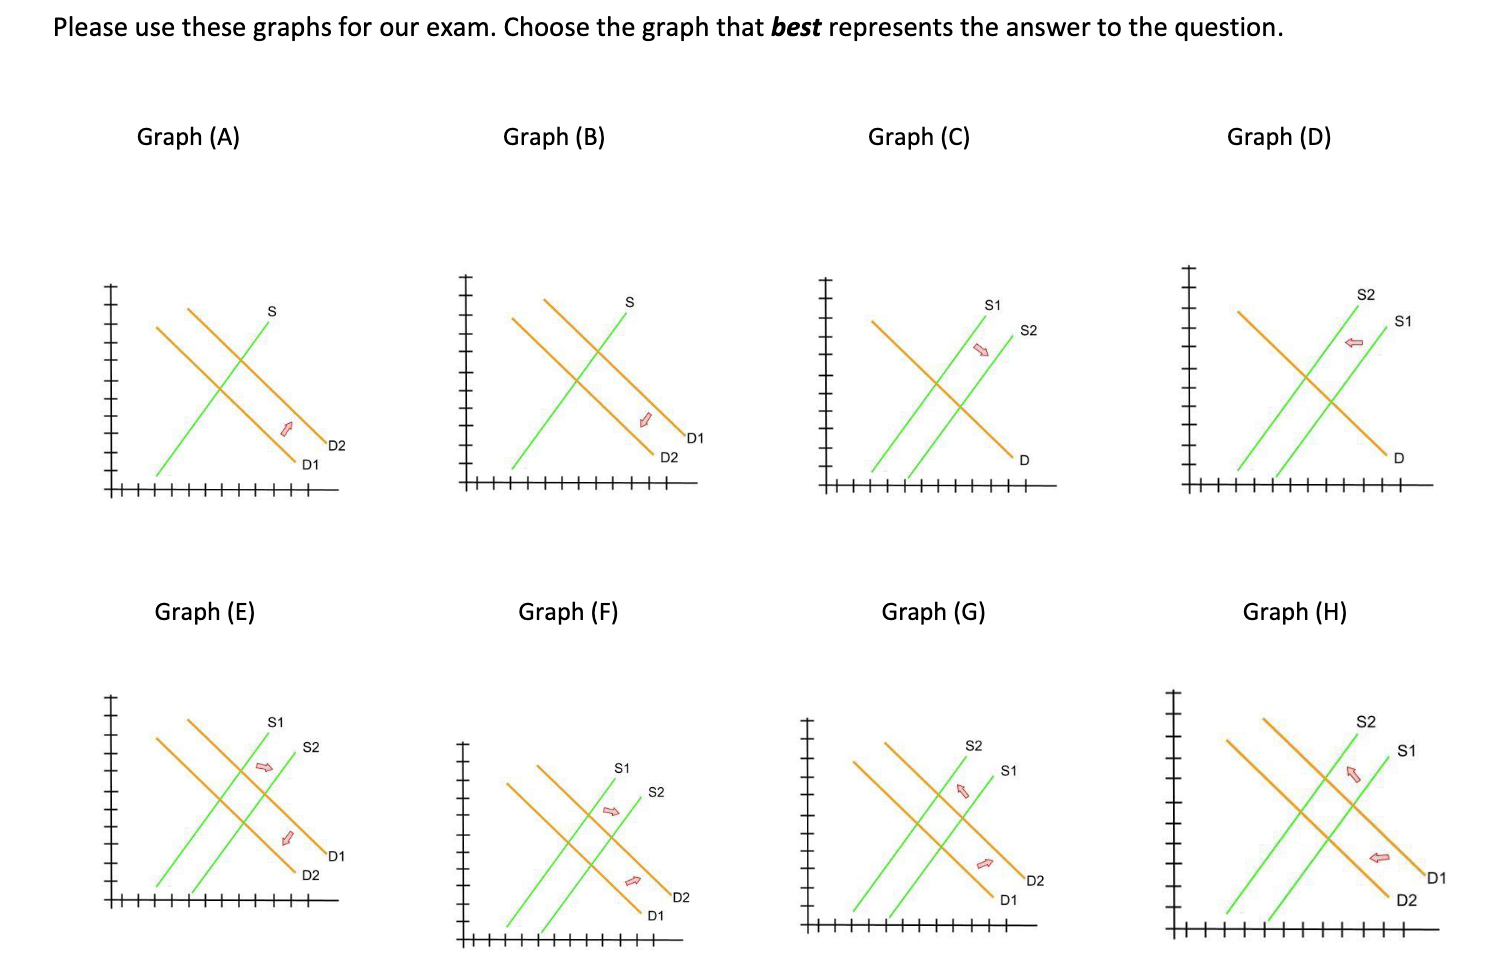
Using your graphing document, select the graph that best demonstrates both of the scenarios listed below: Consumers are told that the consumption of cauliflower will
Using your graphing document, select the graph that best demonstrates both of the scenarios listed below:
- Consumers are told that the consumption of cauliflower will significantly reduce the risk of cancer.
- A new fertilizer is developed that increases the yield each season for cauliflower producers.
What do you predict will happen to equilibrium price and quantity as a result of this change?
Step by Step Solution
There are 3 Steps involved in it
Step: 1

Get Instant Access to Expert-Tailored Solutions
See step-by-step solutions with expert insights and AI powered tools for academic success
Step: 2

Step: 3
Ace Your Homework with AI
Get the answers you need in no time with our AI-driven, step-by-step assistance
Get Started
Essentials Of Economics
Authors: Bradley Schiller
7th Edition
0073375802, 9780073375809