-
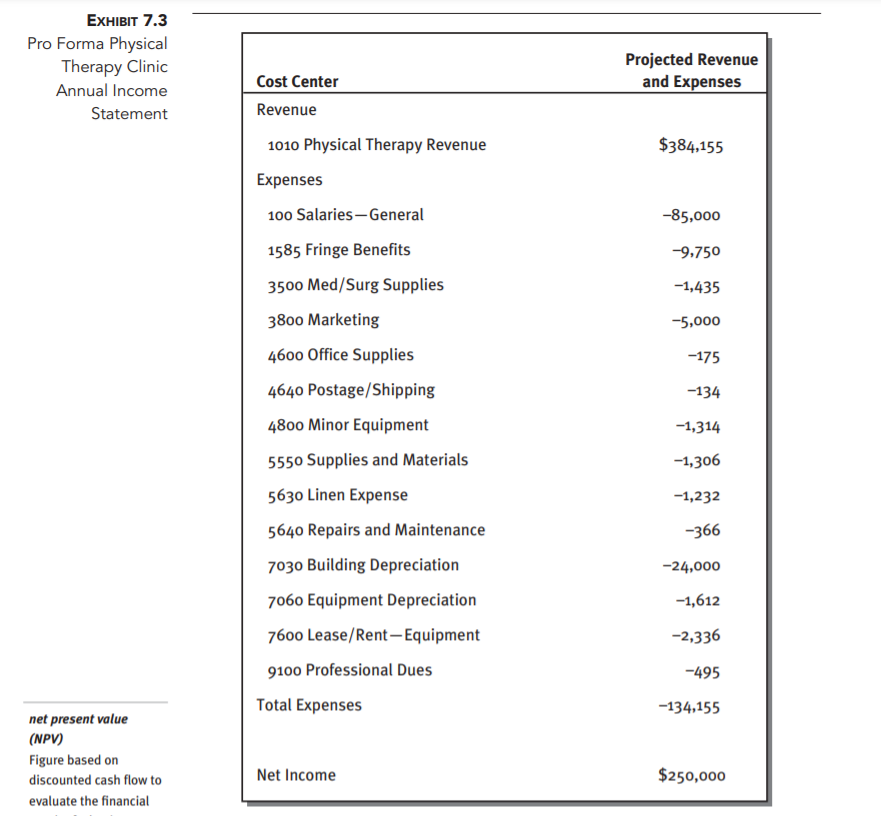
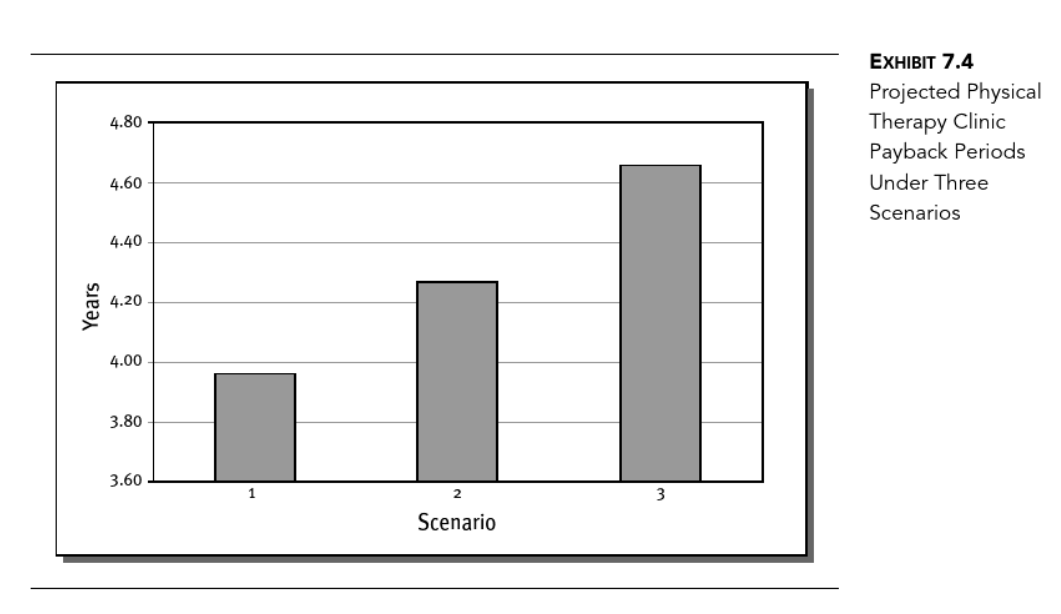
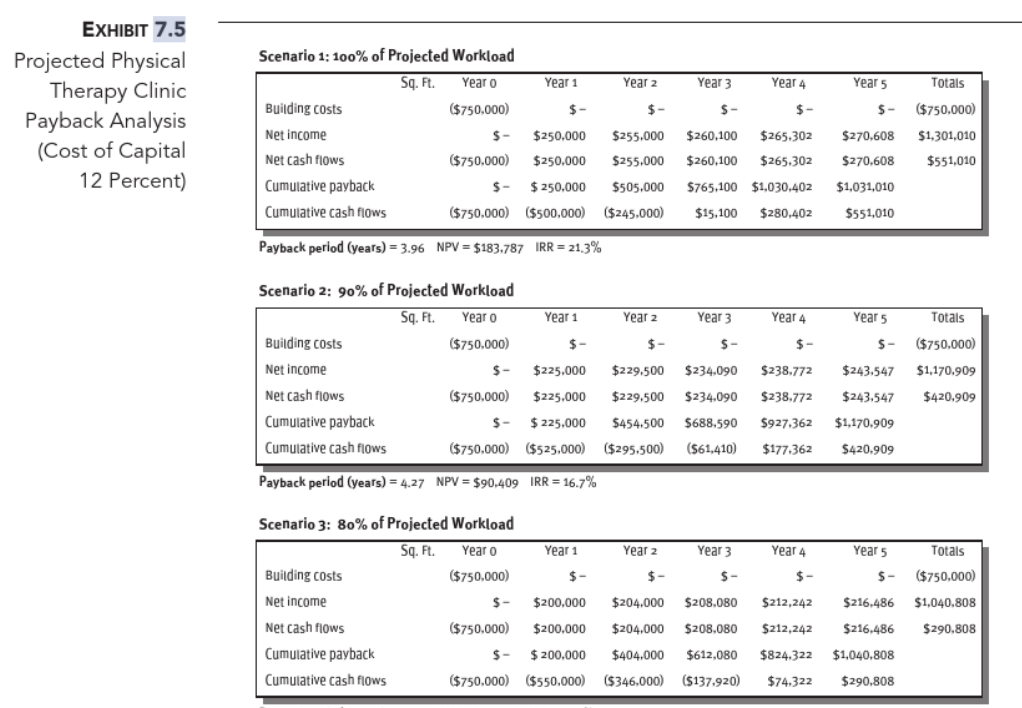
Utilizing the data in exhibits 7.3, 7.4, and 7.5, briefly describe the key sections to include in the business plan.
-
Describe potential HIT systems required in this clinic and how it would benefit the clinic and patients.
-
Describe how you will know the business plan is a success.
-
Discuss the importance of a financial plan and what makes this plan different from the business plan.
EXHIBIT 7.3 Pro Forma Physical Therapy Clinic Annual Income Statement Projected Revenue and Expenses Cost Center Revenue 1010 Physical Therapy Revenue $384,155 Expenses -85,000 100 Salaries - General 1585 Fringe Benefits -9,750 3500 Med/Surg Supplies -1,435 -5,000 -175 -134 -1,314 -1,306 -1,232 3800 Marketing 4600 Office Supplies 4640 Postage/Shipping 4800 Minor Equipment 5550 Supplies and Materials 5630 Linen Expense 5640 Repairs and Maintenance 7030 Building Depreciation 7060 Equipment Depreciation 7600 Lease/Rent -Equipment 9100 Professional Dues Total Expenses -366 -24,000 -1,612 -2,336 -495 -134,155 net present value (NPV) Figure based on discounted cash flow to evaluate the financial Net Income $250,000 4.80 EXHIBIT 7.4 Projected Physical Therapy Clinic Payback Periods Under Three Scenarios 4.60 4.40 Years 4.20 4.00 3.80 3.60 2 Scenario Scenario 1: 100% of Projected Workload Sq. Ft. Year o Year 1 Year 2 Year 3 Year 4 Year 5 Totals EXHIBIT 7.5 Projected Physical Therapy Clinic Payback Analysis (Cost of Capital 12 Percent) Building Costs ($750.000) $ $- $ $ $- ($750.000) Net income $250.000 $260,100 $265.302 $270.608 $1,301,010 $- ($750.000) $255.000 $255.000 Net cash flows $250.000 $260,100 $265.302 $270.608 $551,010 S- $ 250.000 $505.000 $765,100 $1,030.402 $1,031,010 Cumulative payback Cumulative cash flows ($750.000) ($500.000) ($245.000) $15.100 $280,402 $551,010 Payback period (years) = 3.96 NPV = $183,787 IRR = 21,3% Year 1 Year 2 Year 3 Year 4 Year 5 Totals Scenario 2: 90% of Projected Workload Sq. Ft. Year o Building costs ($750.000) Net income $- $ $ $ $- $ $750,000) $225.000 $229,500 $234,090 $238.772 $243.547 $1,170.909 Net cash flows ($750.000) $225,000 $229,500 $234.090 $238.772 $243.547 $420.909 $454.500 $927.362 $1,170.909 Cumulative payback Cumulative cash flows $- $225,000 ($750.000) $525.000) $688.590 (561,410) ($295,500) $177.362 $420,909 Payback period (years) = 4.27 NPV = $90,409 IRR = 16.7% Year 4 Year 5 Totals $- $- ($750.000) Scenario 3: 80% of Projected Workload Sq. Ft. Year o Year 1 Year 2 Year 3 Building Costs ($750,000) $ $- $- Net income $- $200.000 $204.000 $208.080 Net cash flows ($750.000) $200.000 $204.000 $208.080 Cumulative payback $- $ 200.000 $404.000 $612,080 Cumulative cash flows ($750.000) $550.000) ($346,000) ($137.920) $212,242 $216.486 $1.040.808 $212,242 $216,486 $290.808 $824.322 $1,040.808 $74.322 $290.808