Answered step by step
Verified Expert Solution
Link Copied!

Question

1 Approved Answer

Utilizing this article, URL given below, for doing the questions. Espacially for part A, please explain how you will utilize the pound thing into your

Utilizing this article, URL given below, for doing the questions.

Espacially for part A, please explain how you will utilize the pound thing into your calculations, because for me, it is not making any sense.Below is the URL for article to be used:

https://www.thepacker.com/article/produce-prices-down-california-report-says

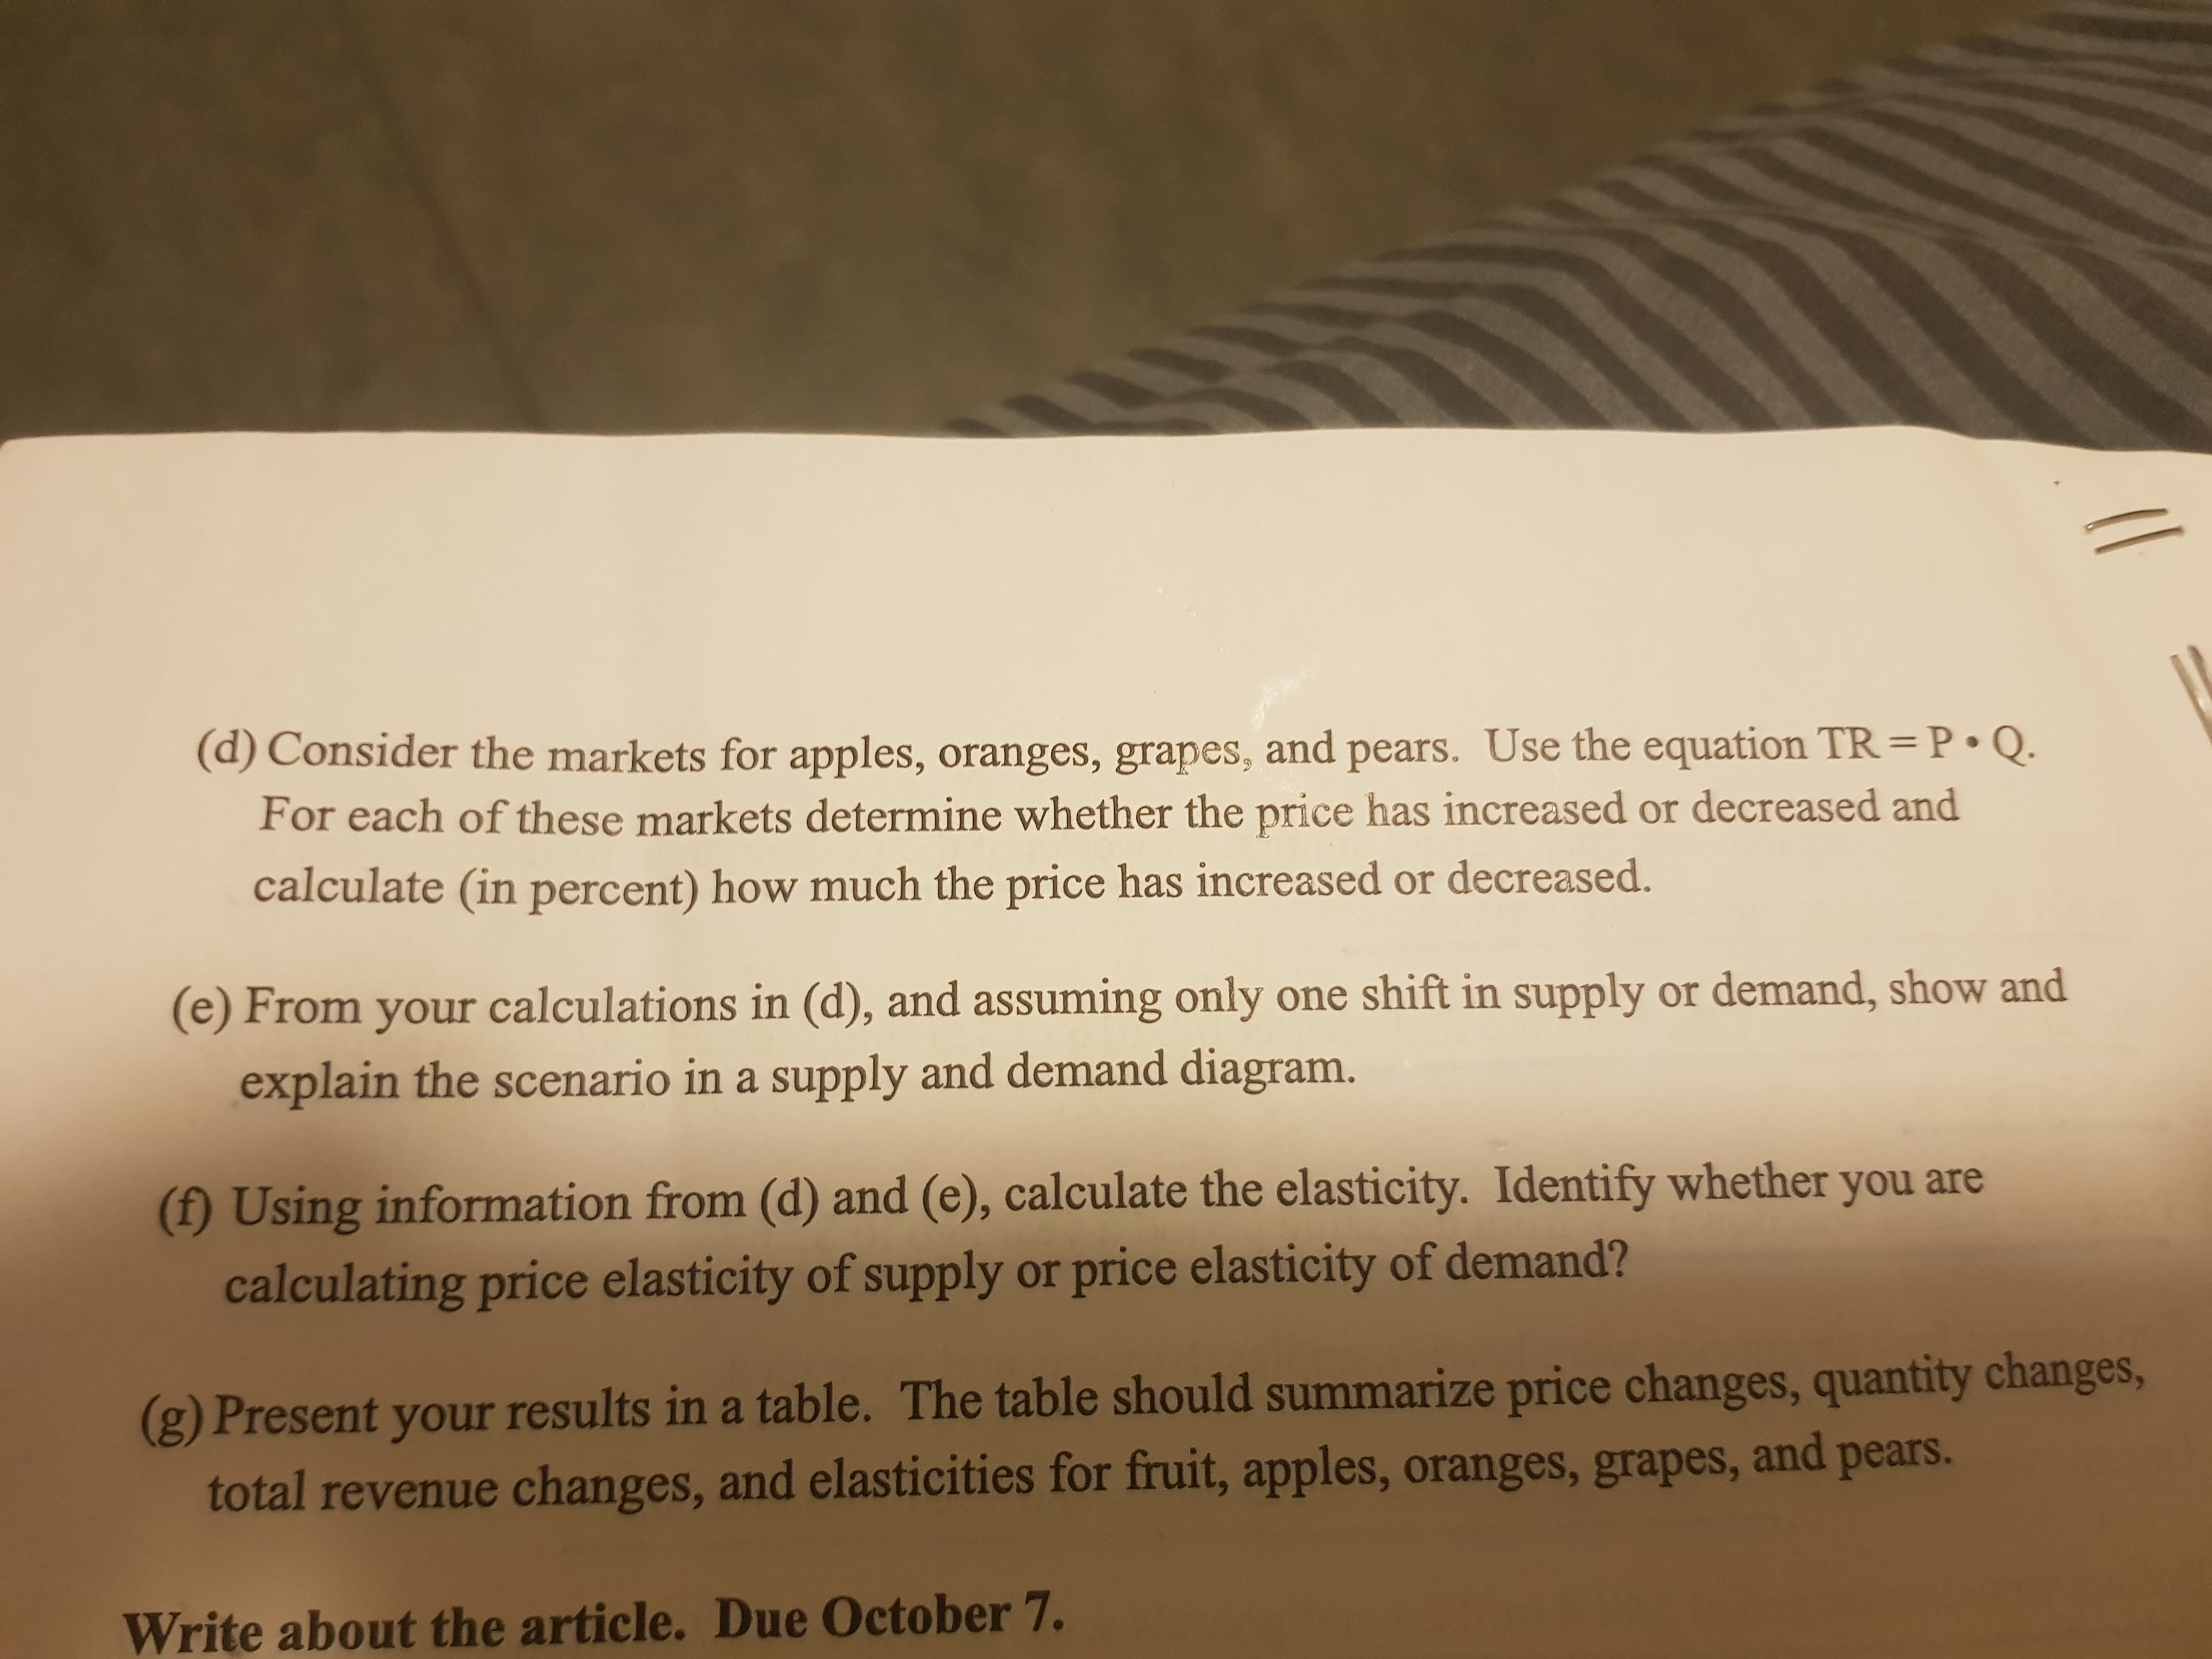
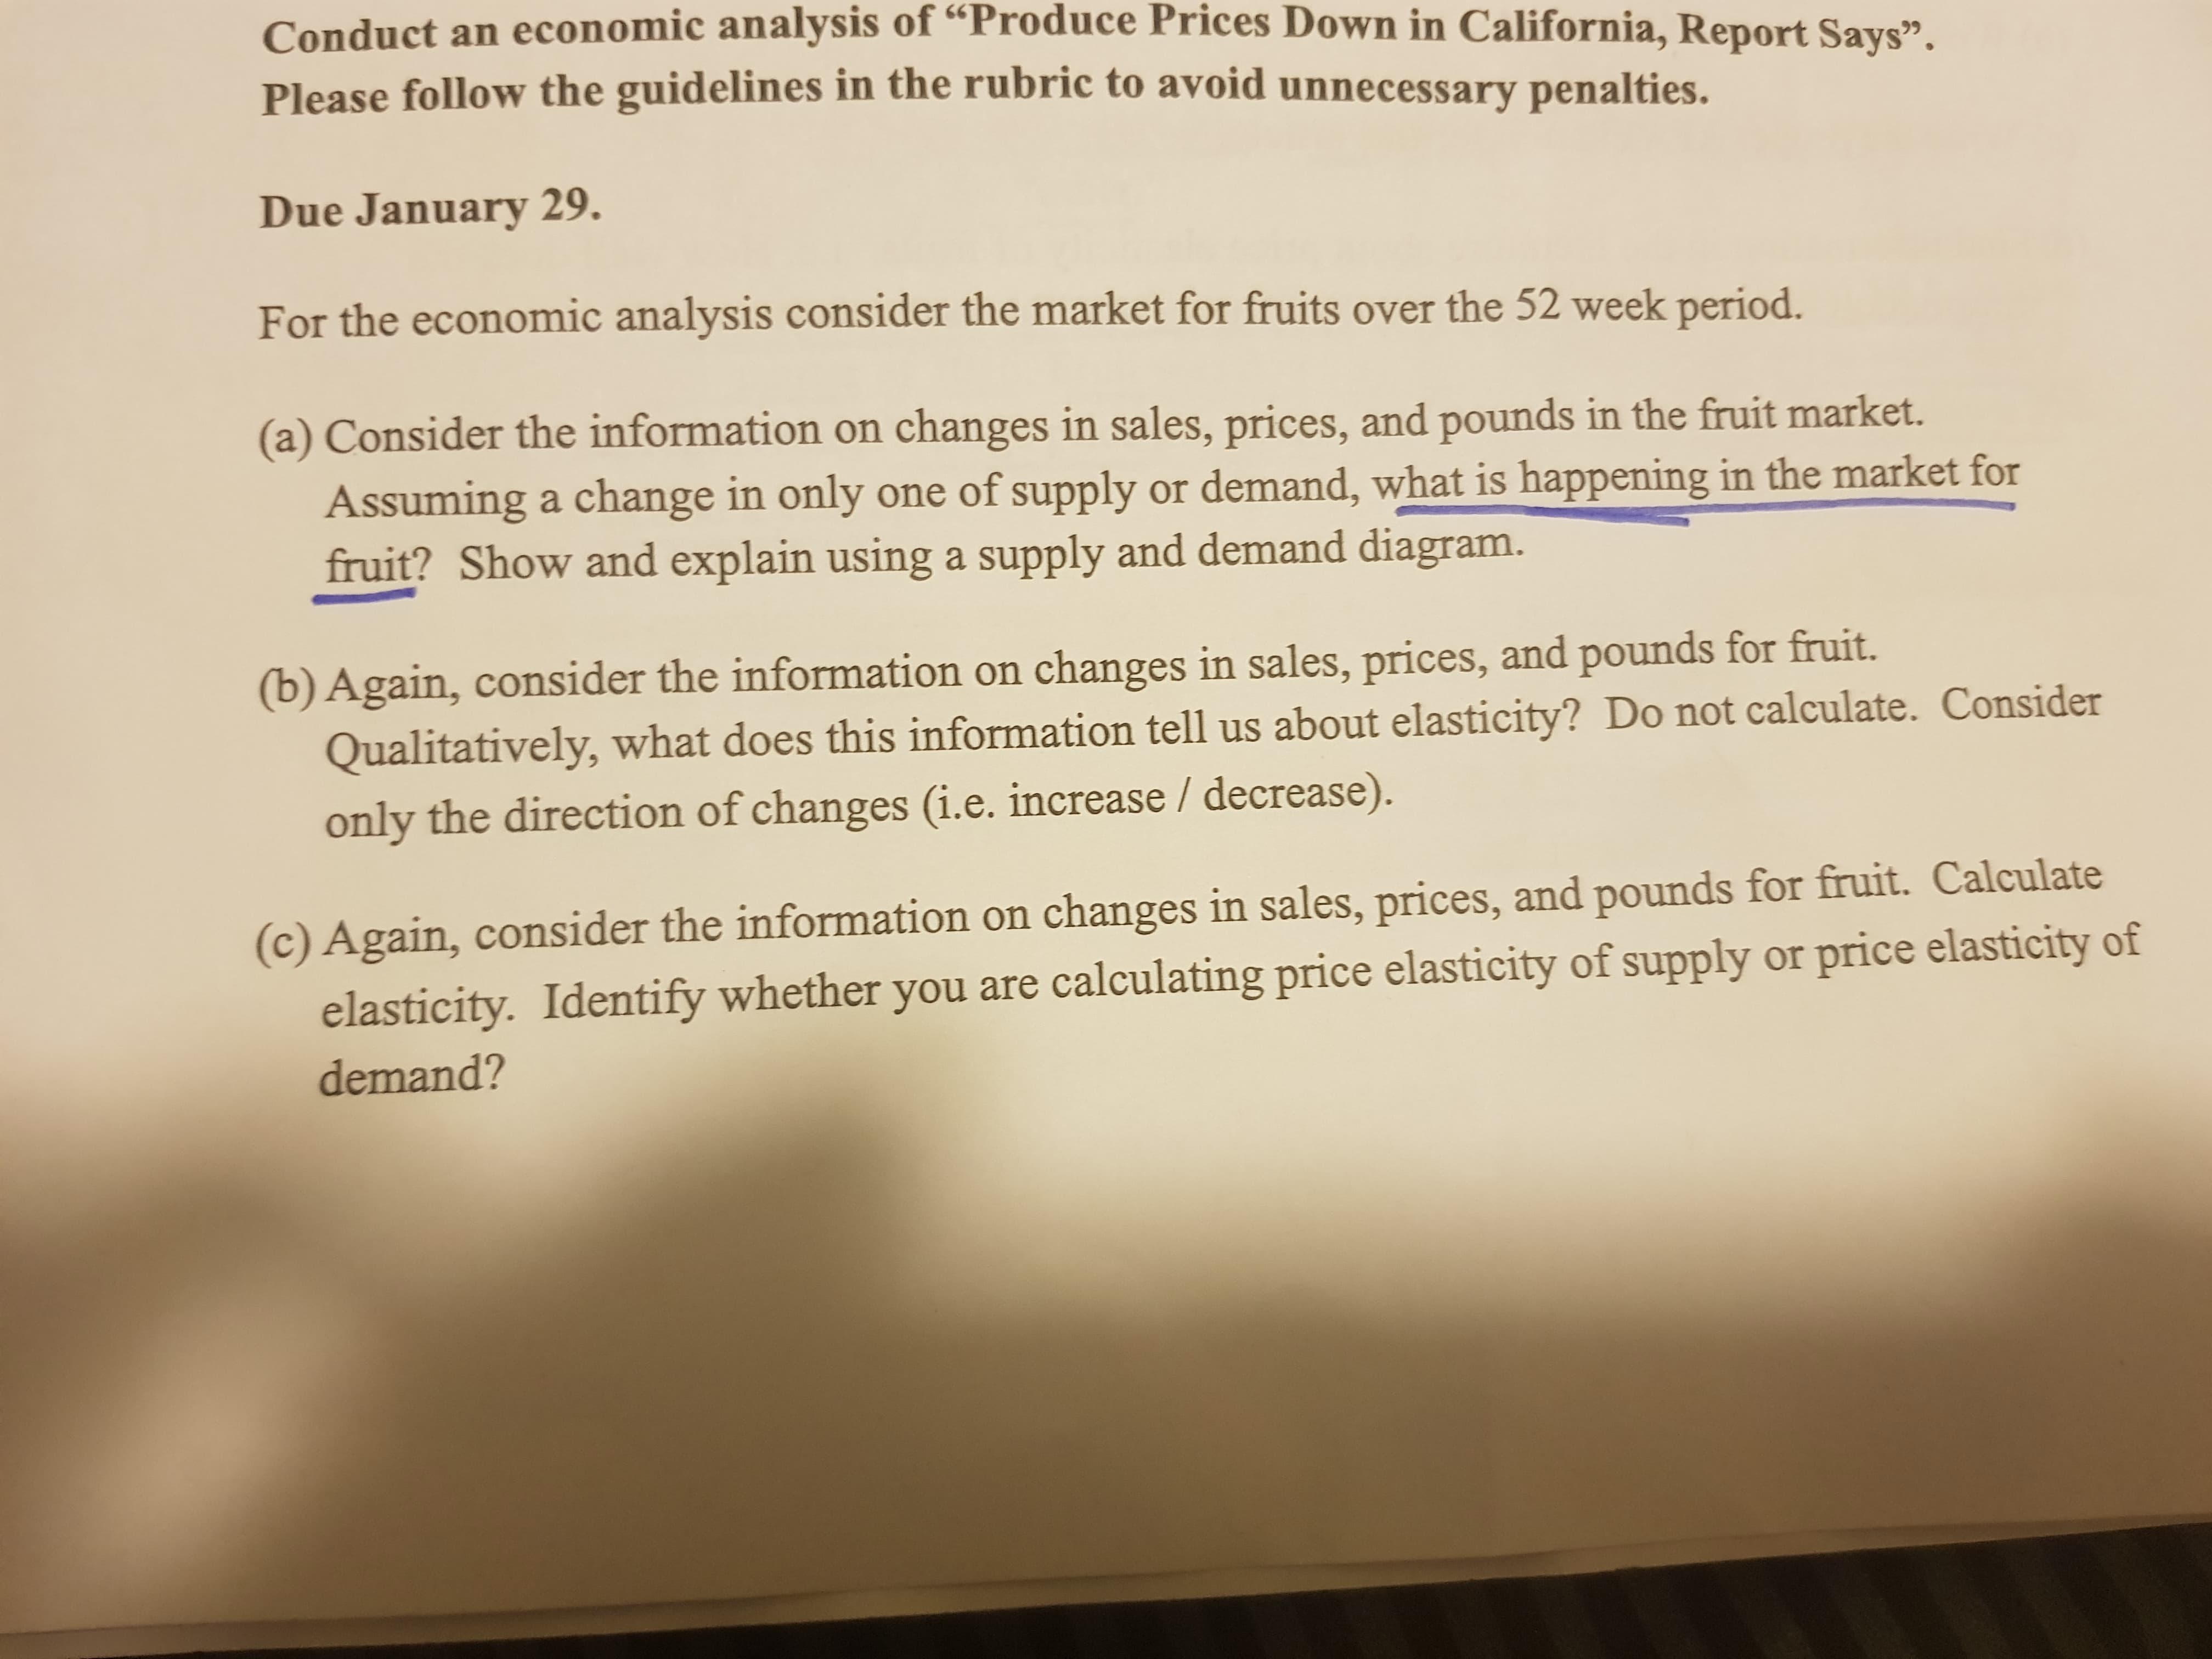
^ Copy Paste the above link for the article. The questions are given below from A to G, after which the questions are what I have already done. Please be advised, this is to understand how to go about these questions.

image text in transcribedimage text in transcribed
(d) Consider the markets for apples, oranges, grapes, and pears. Use the equation TR = P . Q. For each of these markets determine whether the price has increased or decreased and calculate (in percent) how much the price has increased or decreased. (e) From your calculations in (d), and assuming only one shift in supply or demand, show and explain the scenario in a supply and demand diagram. (f) Using information from (d) and (e), calculate the elasticity. Identify whether you are calculating price elasticity of supply or price elasticity of demand? (g) Present your results in a table. The table should summarize price changes, quantity changes, total revenue changes, and elasticities for fruit, apples, oranges, grapes, and pears. Write about the article. Due October 7.Conduct an economic analysis of "Produce Prices Down in California, Report Says". Please follow the guidelines in the rubric to avoid unnecessary penalties. Due January 29. For the economic analysis consider the market for fruits over the 52 week period. (a) Consider the information on changes in sales, prices, and pounds in the fruit market. Assuming a change in only one of supply or demand, what is happening in the market for fruit? Show and explain using a supply and demand diagram. (b) Again, consider the information on changes in sales, prices, and pounds for fruit. Qualitatively, what does this information tell us about elasticity? Do not calculate. Consider only the direction of changes (i.e. increase / decrease). (c) Again, consider the information on changes in sales, prices, and pounds for fruit. Calculate elasticity. Identify whether you are calculating price elasticity of supply or price elasticity of demand

Step by Step Solution

There are 3 Steps involved in it

Step: 1

blur-text-image

Get Instant Access to Expert-Tailored Solutions

See step-by-step solutions with expert insights and AI powered tools for academic success

Step: 2

blur-text-image

Step: 3

blur-text-image

Ace Your Homework with AI

Get the answers you need in no time with our AI-driven, step-by-step assistance

Get Started

Recommended Textbook for

Principles of economics

Authors: N. Gregory Mankiw

6th Edition

978-0538453059, 9781435462120, 538453052, 1435462122, 978-0538453042

More Books

Students also viewed these Economics questions

Question

LO12.3 Explain how demand is seen by a pure monopoly.

Answered: 1 week ago