Answered step by step
Verified Expert Solution
Link Copied!

Question

1 Approved Answer

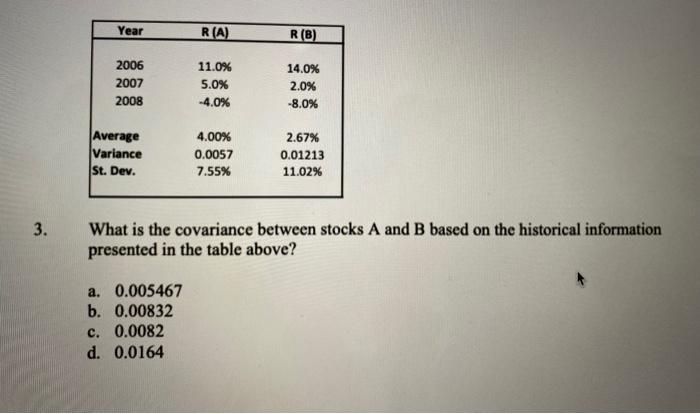
V4 Year R (A) R (B) 2006 11.0% 14.0% 2007 5.0% 2.0% 2008 -4.0% -8.0% Average 4.00%% 2.67% Variance 0.0057 0.01213 St. Dev. 7.55% 11.02%

V4

image text in transcribedimage text in transcribedimage text in transcribed
Year R (A) R (B) 2006 11.0% 14.0% 2007 5.0% 2.0% 2008 -4.0% -8.0% Average 4.00%% 2.67% Variance 0.0057 0.01213 St. Dev. 7.55% 11.02% 3. What is the covariance between stocks A and B based on the historical information presented in the table above? a. 0.005467 b. 0.00832 c. 0.0082 d. 0.0164Answer the next 2 questions based on the following Variance-Covariance Matrix: A B C D 0.0025 0.00125 -0.043 0.00125 0.007 0.018 C -0.043 0.018 0.0006 7. Which two stocks would result in a greatest potential benefit of diversification if combined in a portfolio: a. A & B b. A & C C. B & C d. A & A e. B & B f. C & C7. Which two stocks would result in a greatest potential benefit of diversification if combined in a portfolio: a. A & B b. A & C c. B & C d. A & A e. B & B f. C & C 8. What is the correlation coefficient between stocks A and B: a. 0.00022 b. 0.00125 c. 0.0025 .0.01075 e. 0.2988

Step by Step Solution

There are 3 Steps involved in it

Step: 1

blur-text-image

Get Instant Access to Expert-Tailored Solutions

See step-by-step solutions with expert insights and AI powered tools for academic success

Step: 2

blur-text-image

Step: 3

blur-text-image

Ace Your Homework with AI

Get the answers you need in no time with our AI-driven, step-by-step assistance

Get Started

Recommended Textbook for

Financial management theory and practice

Authors: Eugene F. Brigham and Michael C. Ehrhardt

13th edition

1439078106, 111197375X, 9781439078105, 9781111973759, 978-1439078099

More Books

Students also viewed these Finance questions

Question

explain the elements that contribute to a motivated team

Answered: 1 week ago