

Question
Valuing an airline for acquisition Apache Airlines, a privately held firm, is looking to buy additional gates at its home airport for $800,000 Apache has
Valuing an airline for acquisition Apache Airlines, a privately held firm, is looking to buy additional gates at its home airport for $800,000 Apache has $240,000 in the bank but that money may not be spent as it is used to pay salaries, suppliers, and equipment Apache asked its bank for a loan but the bank refused saying that Apache's interest-bearing debt to equity was too high at 3.1 The bank said that Apache needed to lower that ratio below 2.3 in order to get the loan Separately, SkyBlue Airlines has approached Apache to see if Apache will buy it.
. The price discussed by the two CEOs is 25x SkyBlue's 2018 net earnings You must calculate this price and compare it with the free cash flow value of SkyBlue, which you must also calculate The CFO wants to know if Apache is overpaying or underpaying for SkyBlue. Show equations used below
| SkyBlue Acquisition | ||||
| - Earnings Multiple | ||||
| - 2018 actual net earnings | ||||
| Price | Price Paid | |||
| Value based on free cash flows: | ||||
| 2019 | 2020 | 2021 | Notes | |
| EBIT | From Pro Formas - EBIT projection | |||
| EBIAT | EBIT minus tax | |||
| - Change in Working Capital | From Pro Formas (exclude Bank note plug!) | |||
| - Change in PP&E | From Pro Formas | |||
| Free Cash Flow | Calculation | |||
| Terminal Value | Assumes growth rate given | |||
| Present Value | Calculation | |||
| PV of Free Cash Flows | Calculation | |||
| - Existing Debt | Bank Loan + CPLT + LTD | |||
| = Present Value of SkyBlue | Calculated value | |||
| (Underpay)/Overpay for SkyBlue | If negative, Apache Airlines paid less than SkyBlue is worth | |||
Balance sheet is below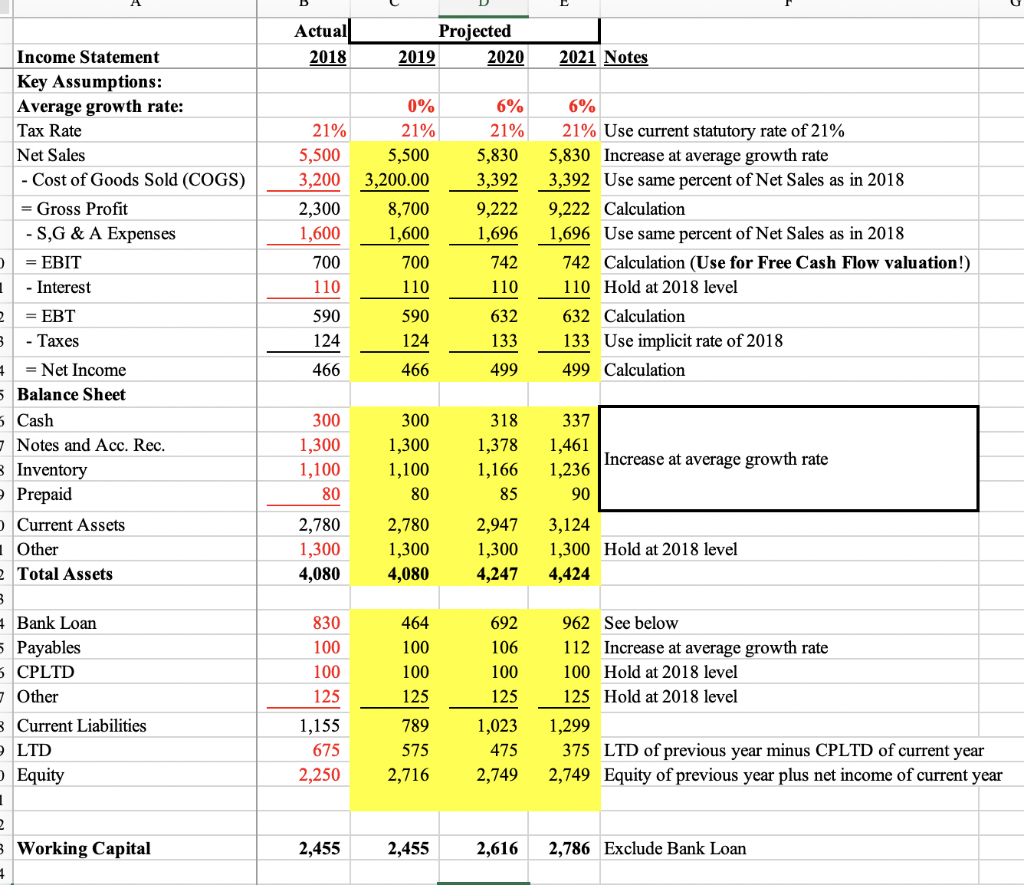
Step by Step Solution
There are 3 Steps involved in it
Step: 1

Get Instant Access to Expert-Tailored Solutions
See step-by-step solutions with expert insights and AI powered tools for academic success
Step: 2

Step: 3
Ace Your Homework with AI
Get the answers you need in no time with our AI-driven, step-by-step assistance
Get Started
Getting The Schools You Want A Step By Step Guide To Conducting Your Own Curriculum Management Audit
Authors: Kimberly M. Logan
1st Edition
0803965443, 978-0803965447