

Answered step by step
Verified Expert Solution
Question
1 Approved Answer
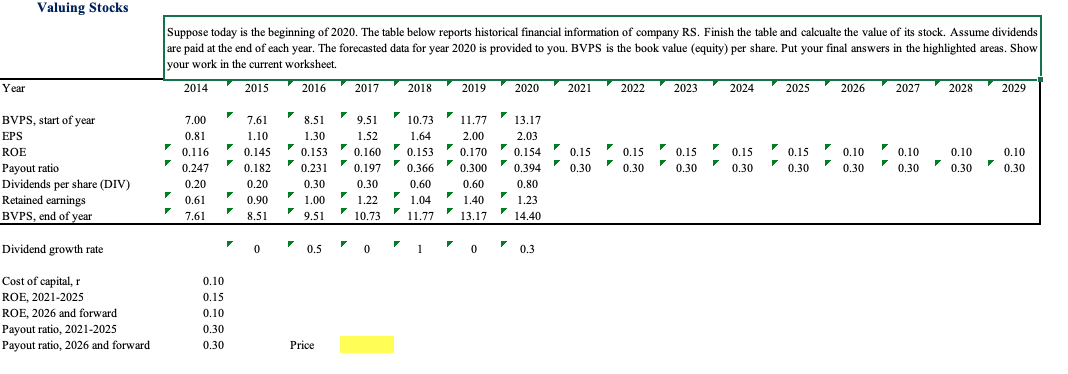
Valuing Stocks Suppose today is the beginning of 2020. The table below reports historical financial information of company RS. Finish the table and calcualte the
Step by Step Solution
There are 3 Steps involved in it
Step: 1

Get Instant Access to Expert-Tailored Solutions
See step-by-step solutions with expert insights and AI powered tools for academic success
Step: 2

Step: 3
Ace Your Homework with AI
Get the answers you need in no time with our AI-driven, step-by-step assistance
Get Started
Financial Markets And Institutions
Authors: Frederic S. Mishkin
2nd Edition
0321014650, 9780321014658