Question
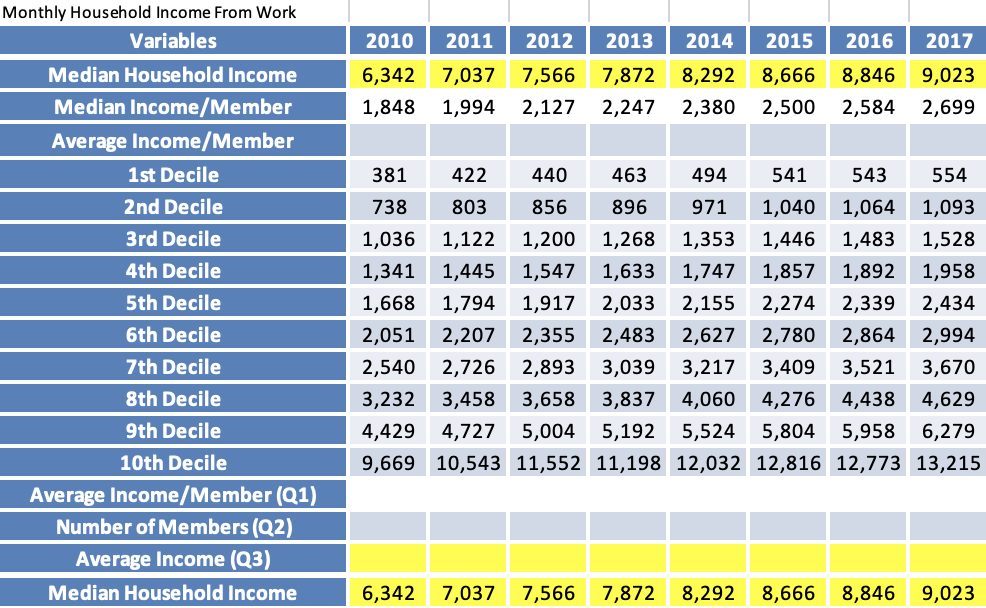
Variables 20102011201220132014201520162017 Median Household Income6,3427,0377,5667,8728,2928,6668,8469,023 Median Income/Member1,8481,9942,1272,2472,3802,5002,5842,699 Average Income/Member 1st Decile 381422440463494541543554 2nd Decile 7388038568969711,0401,064 1,093 3rd Decile 1,0361,1221,2001,268 1,353 1,4461,483 1,528 4th Decile 1,3411,3411,5471,633
Variables 20102011201220132014201520162017
Median Household Income6,3427,0377,5667,8728,2928,6668,8469,023
Median Income/Member1,8481,9942,1272,2472,3802,5002,5842,699
Average Income/Member
1st Decile 381422440463494541543554
2nd Decile 7388038568969711,0401,064 1,093
3rd Decile 1,0361,1221,2001,268 1,353 1,4461,483 1,528
4th Decile 1,3411,3411,5471,633 1,747 1,8571,892 1,958
5th Decile 1,6681,7941,917 2,033 2,155 2,2742,339 2,434
6th Decile 2,0512,2072,3552,4832,627 2,7802,864 2,994
7th Decile 2,5402,7262,8933,0393,217 3,4093,521 3,670
8th Decile 3,2323,4583,6583,8374,0604,2764,438 4,629
9th Decile 4,4294,7275,0045,192 5,524 5,8045,958 6,279
10th Decile 9,66910,54311,552 11,198 12,03212,816 12,773 13,215
Average Income/Member (Q1)
Number of Members (Q2)
Average Income (Q3)
Median Household Income 6,342 7,037 7,566 7,872 8,292 8,666 8,846 9,023
- estimate the Average Income/Member.
- estimate the Number of Members
- estimate the average of household income.
- compare the average and median of household income.
- plot the average and median household income from 2010 to 2017.
- plot the average income/member for all 10 deciles for year 2016 and 2017.

Step by Step Solution
There are 3 Steps involved in it
Step: 1

Get Instant Access to Expert-Tailored Solutions
See step-by-step solutions with expert insights and AI powered tools for academic success
Step: 2

Step: 3

Ace Your Homework with AI
Get the answers you need in no time with our AI-driven, step-by-step assistance
Get Started


