

Answered step by step
Verified Expert Solution
Question
1 Approved Answer
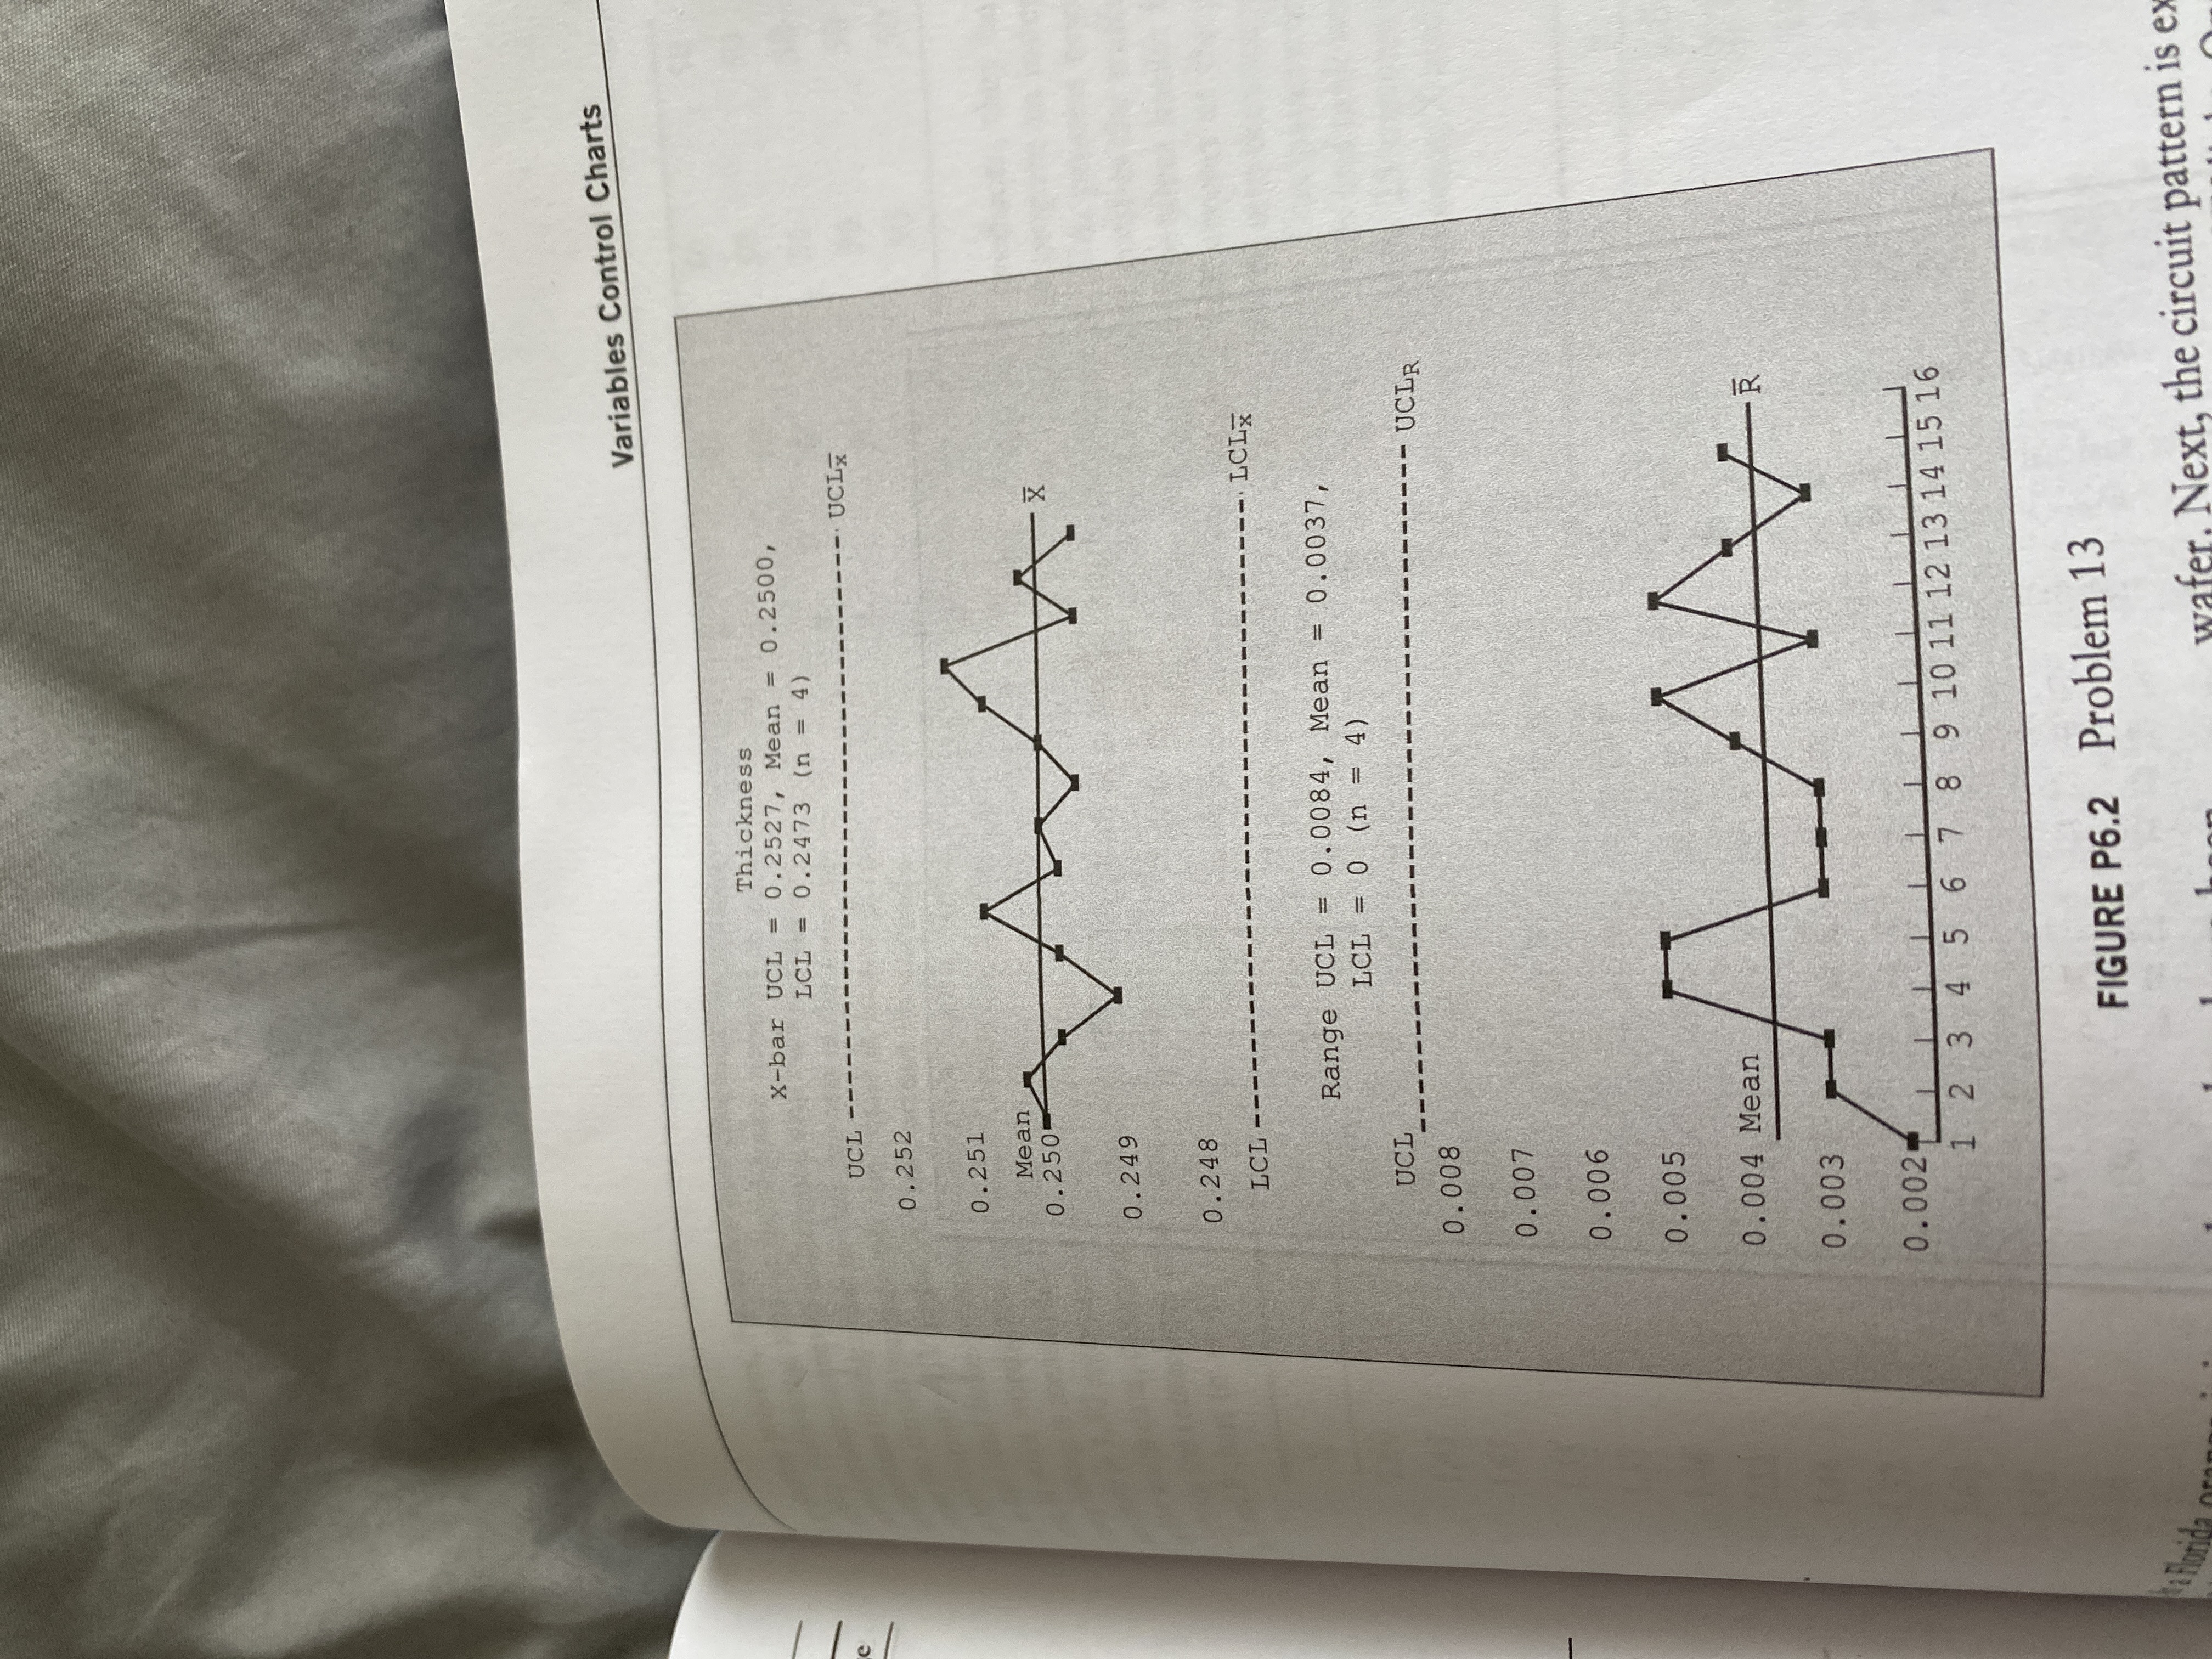
Variables Control Charts Thickness X-bar UCL = 0. 2527, Mean = 0.2500, LCL = 0. 2473 (n = 4) UCL -- UCLx 0 . 252
Step by Step Solution
There are 3 Steps involved in it
Step: 1

Get Instant Access to Expert-Tailored Solutions
See step-by-step solutions with expert insights and AI powered tools for academic success
Step: 2

Step: 3
Ace Your Homework with AI
Get the answers you need in no time with our AI-driven, step-by-step assistance
Get Started
Finite Math And Applied Calculus
Authors: Stefan Waner, Steven Costenoble
6th Edition
1285415132, 9781285415130