

Question
Variance analysis You have conducted some market research for style and size of products you want to use to launch your business. The market research
Variance analysis
You have conducted some market research for style and size of products you want to use to launch your business. The market research has indicated the following sales price ranges will be optimal for your area depending on style of products you choose to sell:
Collars
With pricing at $20 per collar, you can expect to sell 30 collars per day.
With pricing at $24 per collar, you can expect to sell 25 collars per day.
With pricing at $28 per collar, you can expect to sell 20 collars per day
Leashes
With pricing at $22 per leash, you can expect to sell 28 leashes per day.
With pricing at $26 per leash, you can expect to sell 23 leashes per day.
With pricing at $30 per leash, you can expect to sell 18 leashes per day.
Harnesses
With pricing at $25 per harness, you can expect to sell 25 harnesses per day.
With pricing at $30 per harness, you can expect to sell 22 harnesses per day.
With pricing at $35 per harness, you can expect to sell 20 harnesses per day.
Additionally, you will need to compare your break-even points for the following target profits for each area of your business to determine your prices:
Collars
Break-even
$300 target profit each month
$500 target profit each month
Leashes
Break-even
$400 target profit each month
$600 target profit each month
Harnesses
Break-even
$500 target profit each month
$650 target profit each month
Remember that all break-even and target points must be in whole units (we cannot sell a partial unit). Round up when calculating partial units to ensure costs are covered. Excel tip use ROUNDUP function
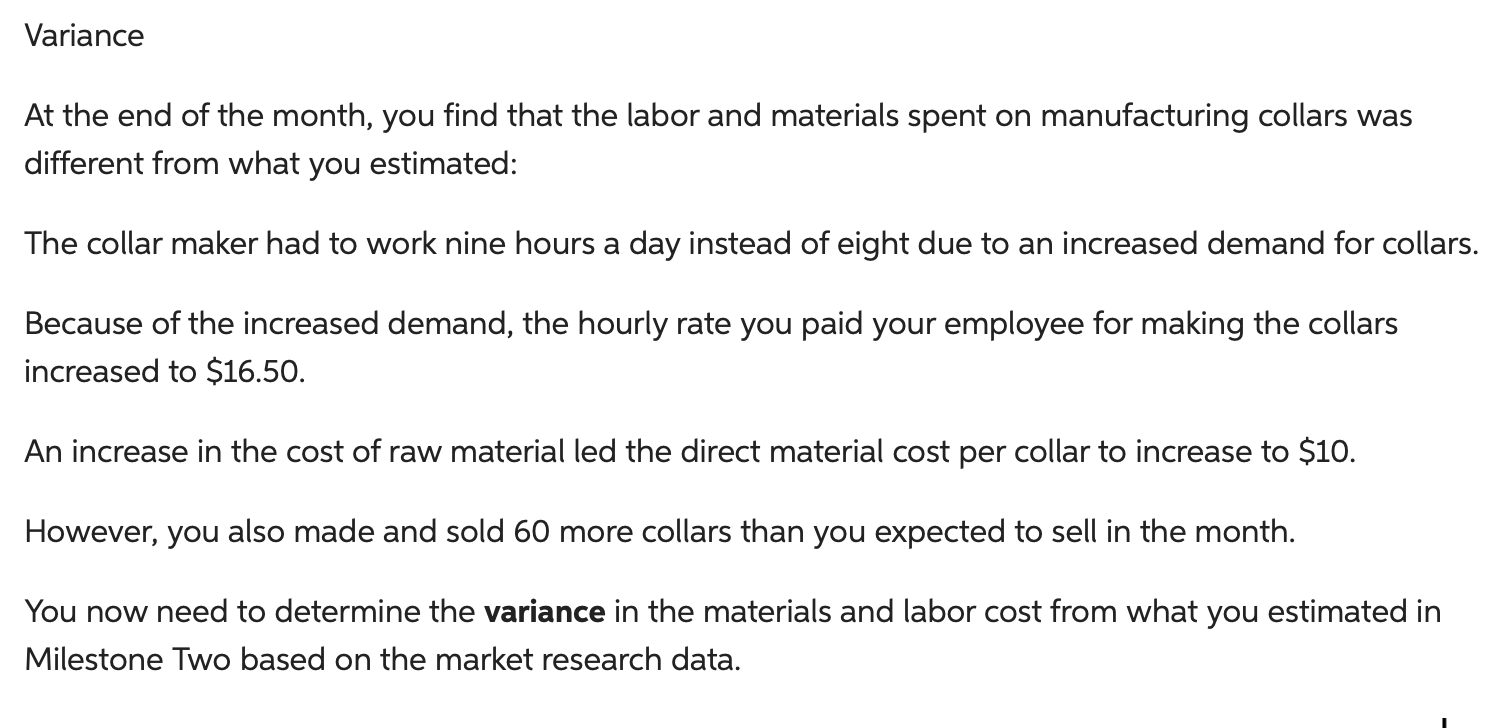
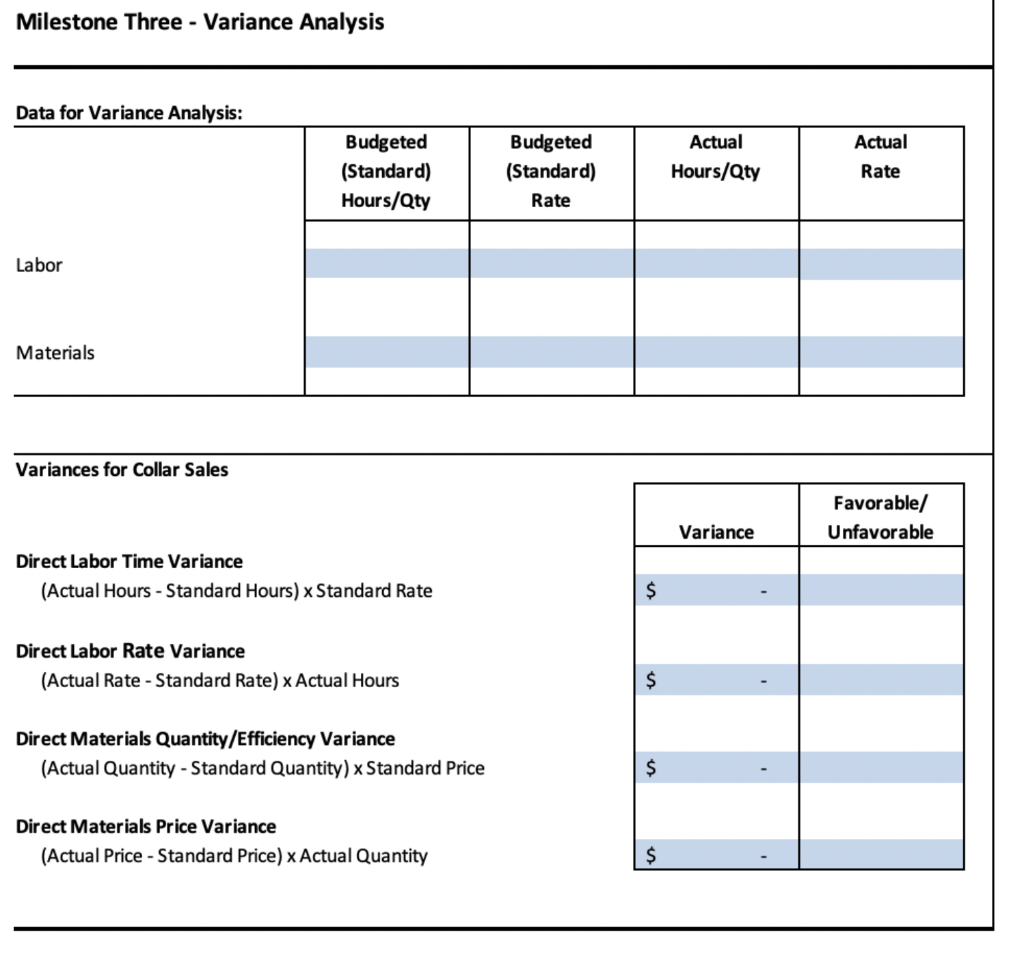
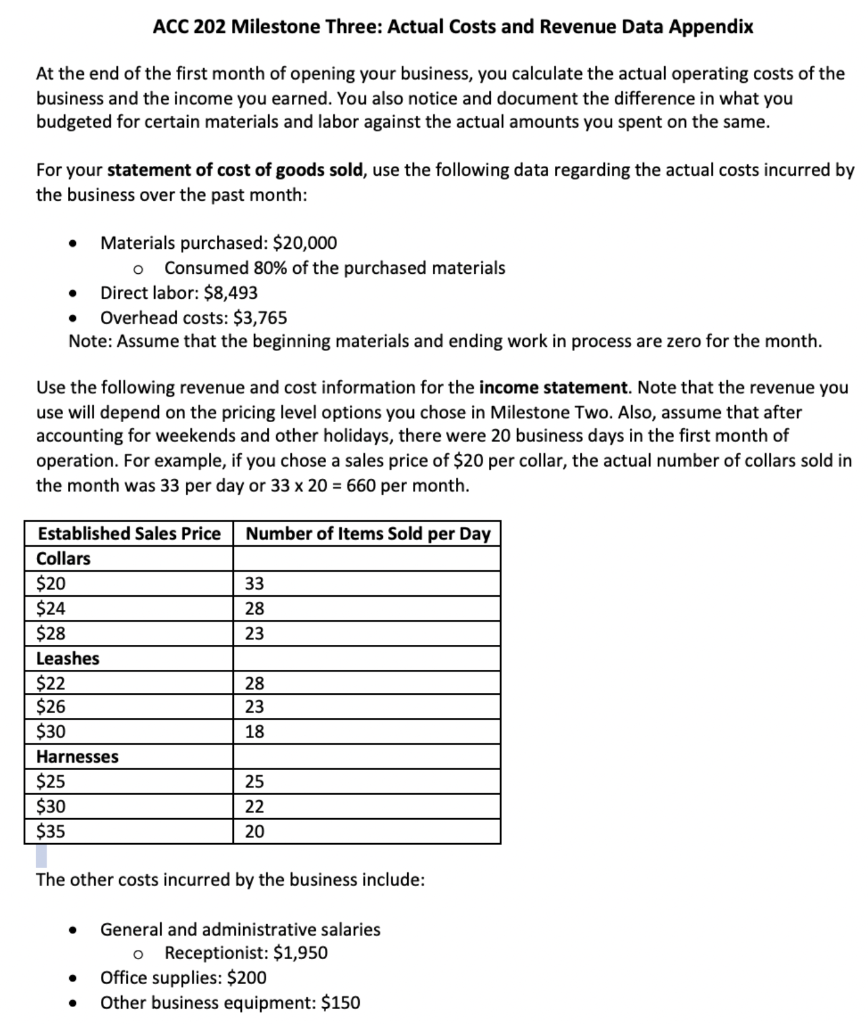
ACC 202 Milestone Three: Actual Costs and Revenue Data Appendix At the end of the first month of opening your business, you calculate the actual operating costs of the business and the income you earned. You also notice and document the difference in what you budgeted for certain materials and labor against the actual amounts you spent on the same. For your statement of cost of goods sold, use the following data regarding the actual costs incurred by the business over the past month: Materials purchased: $20,000 O Consumed 80% of the purchased materials Direct labor: $8,493 Overhead costs: $3,765 Note: Assume that the beginning materials and ending work in process are zero for the month. Use the following revenue and cost information for the income statement. Note that the revenue you use will depend on the pricing level options you chose in Milestone Two. Also, assume that after accounting for weekends and other holidays, there were 20 business days in the first month of operation. For example, if you chose a sales price of $20 per collar, the actual number of collars sold in the month was 33 per day or 33 x 20 = 660 per month. Established Sales Price Number of Items Sold per Day Collars $20 33 $24 28 $28 23 Leashes $22 28 $26 23 $30 18 Harnesses $25 25 $30 22 $35 20 The other costs incurred by the business include: General and administrative salaries O Receptionist: $1,950 Office supplies: $200 Other business equipment: $150 Variance At the end of the month, you find that the labor and materials spent on manufacturing collars was different from what you estimated: The collar maker had to work nine hours a day instead of eight due to an increased demand for collars. Because of the increased demand, the hourly rate you paid your employee for making the collars increased to $16.50. An increase in the cost of raw material led the direct material cost per collar to increase to $10. However, you also made and sold 60 more collars than you expected to sell in the month. You now need to determine the variance in the materials and labor cost from what you estimated in Milestone Two based on the market research data. Milestone Three - Variance Analysis Data for Variance Analysis: Budgeted (Standard) Hours/Qty Labor Materials Variances for Collar Sales Direct Labor Time Variance (Actual Hours - Standard Hours) x Standard Rate Direct Labor Rate Variance (Actual Rate - Standard Rate) x Actual Hours Direct Materials Quantity/Efficiency Variance (Actual Quantity - Standard Quantity) x Standard Price Direct Materials Price Variance (Actual Price - Standard Price) x Actual Quantity Budgeted (Standard) Rate $ $ Actual Hours/Qty Variance Actual Rate Favorable/ Unfavorable
Step by Step Solution
There are 3 Steps involved in it
Step: 1

Get Instant Access to Expert-Tailored Solutions
See step-by-step solutions with expert insights and AI powered tools for academic success
Step: 2

Step: 3
Ace Your Homework with AI
Get the answers you need in no time with our AI-driven, step-by-step assistance
Get Started
Financial and Managerial Accounting
Authors: Belverd E. Needles, Marian Powers, Susan V. Crosson
9th edition
1439037809, 978-1439037805