

Answered step by step
Verified Expert Solution
Question
1 Approved Answer
Variance and standard deviation. Calculate the variance and the standard deviation of U.S. Treasury bills, long- term government bonds, and small-company stocks for 1950
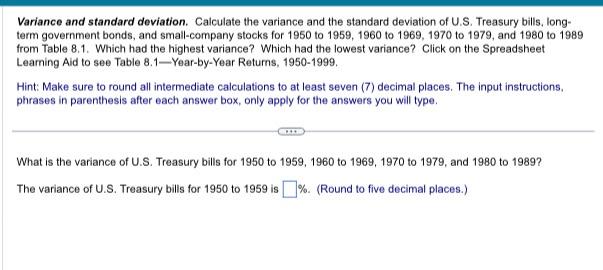
Variance and standard deviation. Calculate the variance and the standard deviation of U.S. Treasury bills, long- term government bonds, and small-company stocks for 1950 to 1959, 1960 to 1969, 1970 to 1979, and 1980 to 1989 from Table 8.1. Which had the highest variance? Which had the lowest variance? Click on the Spreadsheet Learning Aid to see Table 8.1-Year-by-Year Returns, 1950-1999. Hint: Make sure to round all intermediate calculations to at least seven (7) decimal places. The input instructions, phrases in parenthesis after each answer box, only apply for the answers you will type. What is the variance of U.S. Treasury bills for 1950 to 1959, 1960 to 1969, 1970 to 1979, and 1980 to 1989? The variance of U.S. Treasury bills for 1950 to 1959 is %. (Round to five decimal places.)
Step by Step Solution
There are 3 Steps involved in it
Step: 1

Get Instant Access to Expert-Tailored Solutions
See step-by-step solutions with expert insights and AI powered tools for academic success
Step: 2

Step: 3
Ace Your Homework with AI
Get the answers you need in no time with our AI-driven, step-by-step assistance
Get Started
Foundations of Financial Management
Authors: Stanley Block, Geoffrey Hirt, Bartley Danielsen
14th edition
007745443X, 978-0073530727, 73530727, 978-0077454432