

Answered step by step
Verified Expert Solution
Question
1 Approved Answer
Variance, Standard Deviation, Coefficient of Variation (10 Points) 2. Please use the monthly stock prices shown on tab Stock Prices of the financial statements to
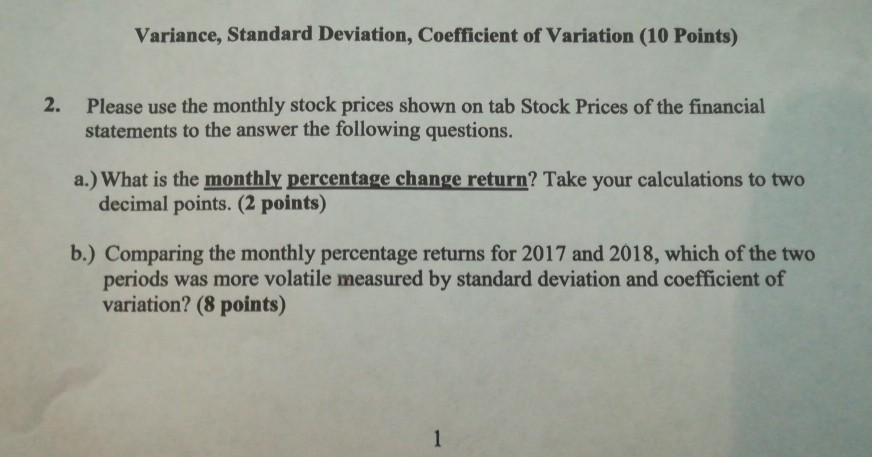
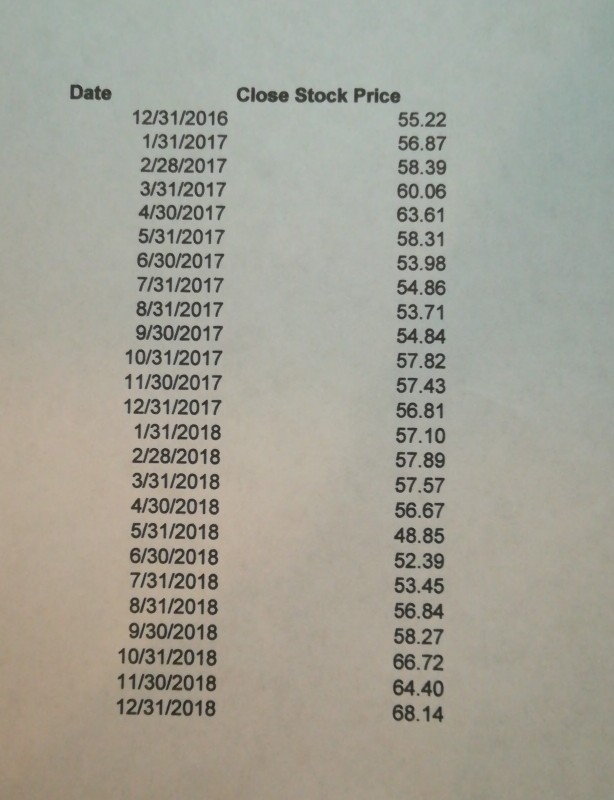
Variance, Standard Deviation, Coefficient of Variation (10 Points) 2. Please use the monthly stock prices shown on tab Stock Prices of the financial statements to the answer the following questions. a.) What is the monthly percentage change return? Take your calculations to two decimal points. (2 points) b.) Comparing the monthly percentage returns for 2017 and 2018, which of the two periods was more volatile measured by standard deviation and coefficient of variation? (8 points) Date Close Stock Price 12/31/2016 55.22 1/31/2017 56.87 2/28/2017 58.39 3/31/2017 60.06 4/30/2017 63.61 5/31/2017 58.31 6/30/2017 53.98 7/31/2017 54.86 8/31/2017 53.71 9/30/2017 54.84 10/31/2017 57.82 11/30/2017 57.43 12/31/2017 56.81 1/31/2018 57.10 2/28/2018 57.89 3/31/2018 57.57 4/30/2018 56.67 5/31/2018 48.85 6/30/2018 52.39 7/31/2018 53.45 8/31/2018 56.84 9/30/2018 58.27 10/31/2018 66.72 11/30/2018 64.40 12/31/2018 68.14
Step by Step Solution
There are 3 Steps involved in it
Step: 1

Get Instant Access to Expert-Tailored Solutions
See step-by-step solutions with expert insights and AI powered tools for academic success
Step: 2

Step: 3
Ace Your Homework with AI
Get the answers you need in no time with our AI-driven, step-by-step assistance
Get Started
Finance And Profitability
Authors: David Irwin
1st Edition
1854180649, 9781854180643