

Question
VBA programming Instead of a queueing simulation, what is asked is a userform with inputs of: numbers of servers, mean arrival time of customers (ex.
VBA programming
Instead of a queueing simulation, what is asked is a userform with inputs of: numbers of servers, mean arrival time of customers (ex. a customer enters every 1.5minutes), a mean service time (ex. 5minutes of service per customer) and total working hours(ex. 480minutes in a normal bank day). The outputs must be a whole rows of the mean customer arrival time of customers, the mean service time of the servers and the accumulated time of each customer from the start. These must be within the 480minutes of the working day so the aunt of the mean arrival or service time must be 480minutes each (it can totally less than 480 but not more).
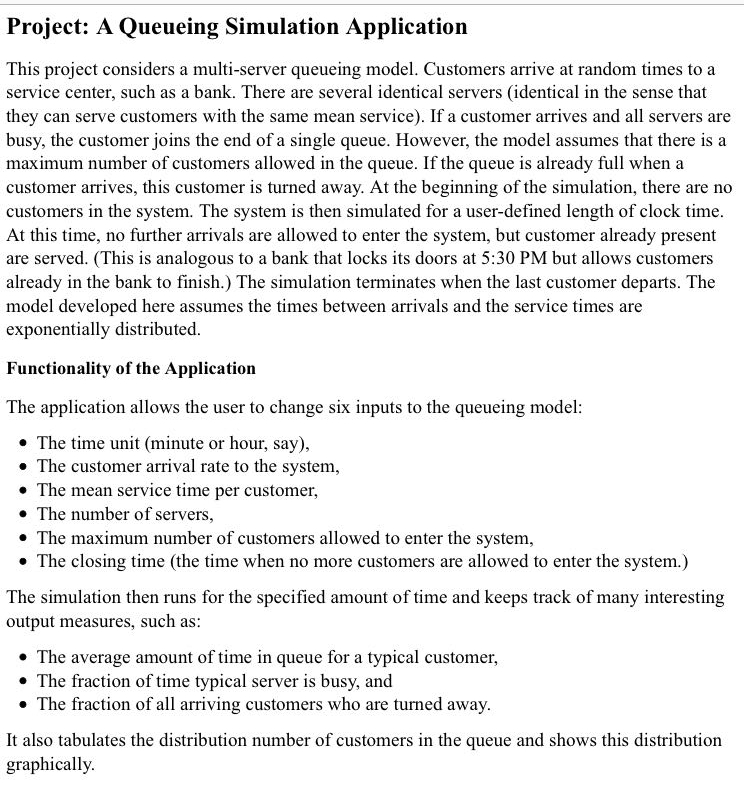
Project: A Queueing Simulation Application This project considers a multi-server queueing model. Customers arrive at random times to a service center, such as a bank. There are several identical servers (identical in the sense that they can serve customers with the same mean service). If a customer arrives and all servers are busy, the customer joins the end of a single queue. However, the model assumes that there is a maximum number of customers allowed in the queue. If the queue is already full when a customer arrives, this customer is turned away. At the beginning of the simulation, there are no customers in the system. The system is then simulated for a user-defined length of clock time At this time, no further arrivals are allowed to enter the system, but customer already present are served. (This is analogous to a bank that locks its doors at 5:30 PM but allows customers already in the bank to finish.) The simulation terminates when the last customer departs. The model developed here assumes the times between arrivals and the service times are exponentially distributed. Functionality of the Application The application allows the user to change six inputs to the queueing model * The time unit (minute or hour, say), . The customer arrival rate to the system, . The mean service time per customer, The number of servers, * The maximum number of customers allowed to enter the system, * The closing time (the time when no more customers are allowed to enter the system.) The simulation then runs for the specified amount of time and keeps track of many interesting output measures, such as: * The average amount of time in queue for a typical customer, * The fraction of time typical server is busy, and * The fraction of all arriving customers who are turned away It also tabulates the distribution number of customers in the queue and shows this distribution graphically Project: A Queueing Simulation Application This project considers a multi-server queueing model. Customers arrive at random times to a service center, such as a bank. There are several identical servers (identical in the sense that they can serve customers with the same mean service). If a customer arrives and all servers are busy, the customer joins the end of a single queue. However, the model assumes that there is a maximum number of customers allowed in the queue. If the queue is already full when a customer arrives, this customer is turned away. At the beginning of the simulation, there are no customers in the system. The system is then simulated for a user-defined length of clock time At this time, no further arrivals are allowed to enter the system, but customer already present are served. (This is analogous to a bank that locks its doors at 5:30 PM but allows customers already in the bank to finish.) The simulation terminates when the last customer departs. The model developed here assumes the times between arrivals and the service times are exponentially distributed. Functionality of the Application The application allows the user to change six inputs to the queueing model * The time unit (minute or hour, say), . The customer arrival rate to the system, . The mean service time per customer, The number of servers, * The maximum number of customers allowed to enter the system, * The closing time (the time when no more customers are allowed to enter the system.) The simulation then runs for the specified amount of time and keeps track of many interesting output measures, such as: * The average amount of time in queue for a typical customer, * The fraction of time typical server is busy, and * The fraction of all arriving customers who are turned away It also tabulates the distribution number of customers in the queue and shows this distribution graphicallyStep by Step Solution
There are 3 Steps involved in it
Step: 1

Get Instant Access to Expert-Tailored Solutions
See step-by-step solutions with expert insights and AI powered tools for academic success
Step: 2

Step: 3
Ace Your Homework with AI
Get the answers you need in no time with our AI-driven, step-by-step assistance
Get Started
Select Healthcare Classification Systems And Databases
Authors: Katherine S. Rowell, Ann Cutrell
1st Edition
0615909760, 978-0615909769