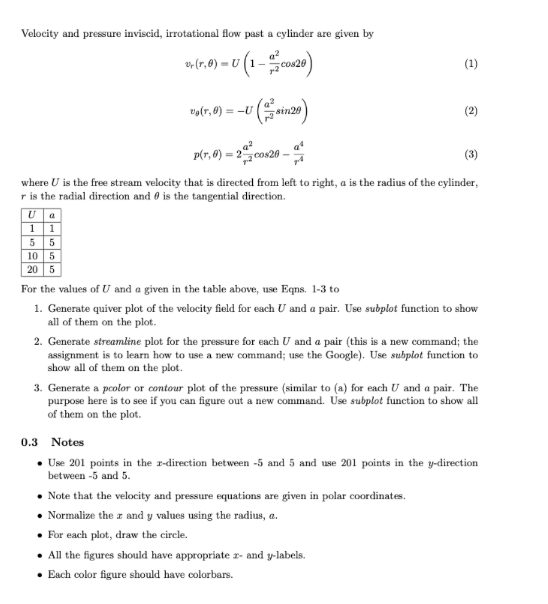
Velocity and pressure inviscid, irrotational flow past a cylinder are given by er(0,0) = 0 (1 - .co20) (1) U- = (8 ,) (2) pr, @) = 25. 00:20 (3) where U is the free stream velocity that is directed from left to right, a is the radius of the cylinder, r is the radial direction and 6 is the tangential direction 1 1 5 5 105 205 For the values of U and a given in the table above, use Egns. 1-3 to 1. Generate quiver plot of the velocity field for each U and a pair. Use subplot function to show all of them on the plot. 2. Generate streamline plot for the pressure for each U and a pair (this is a new command; the assignment is to learn how to use a new command; use the Google). Use subplot function to show all of them on the plot. 3. Generate a poolor or contour plot of the pressure (similar to (a) for each U and a pair. The purpose here is to see if you can figure out a new command. Use subplot function to show all of them on the plot. 0.3 Notes . Use 201 points in the 2-direction between -5 and 5 and use 201 points in the y-direction between -5 and 5. Note that the velocity and pressure equations are given in polar coordinates. Normalize the r and y values using the radius, a. . For each plot, draw the circle. All the figures should have appropriate r- and y-labels. Each color figure should have colorbars. Velocity and pressure inviscid, irrotational flow past a cylinder are given by er(0,0) = 0 (1 - .co20) (1) U- = (8 ,) (2) pr, @) = 25. 00:20 (3) where U is the free stream velocity that is directed from left to right, a is the radius of the cylinder, r is the radial direction and 6 is the tangential direction 1 1 5 5 105 205 For the values of U and a given in the table above, use Egns. 1-3 to 1. Generate quiver plot of the velocity field for each U and a pair. Use subplot function to show all of them on the plot. 2. Generate streamline plot for the pressure for each U and a pair (this is a new command; the assignment is to learn how to use a new command; use the Google). Use subplot function to show all of them on the plot. 3. Generate a poolor or contour plot of the pressure (similar to (a) for each U and a pair. The purpose here is to see if you can figure out a new command. Use subplot function to show all of them on the plot. 0.3 Notes . Use 201 points in the 2-direction between -5 and 5 and use 201 points in the y-direction between -5 and 5. Note that the velocity and pressure equations are given in polar coordinates. Normalize the r and y values using the radius, a. . For each plot, draw the circle. All the figures should have appropriate r- and y-labels. Each color figure should have colorbars


