

Answered step by step
Verified Expert Solution
Question
1 Approved Answer
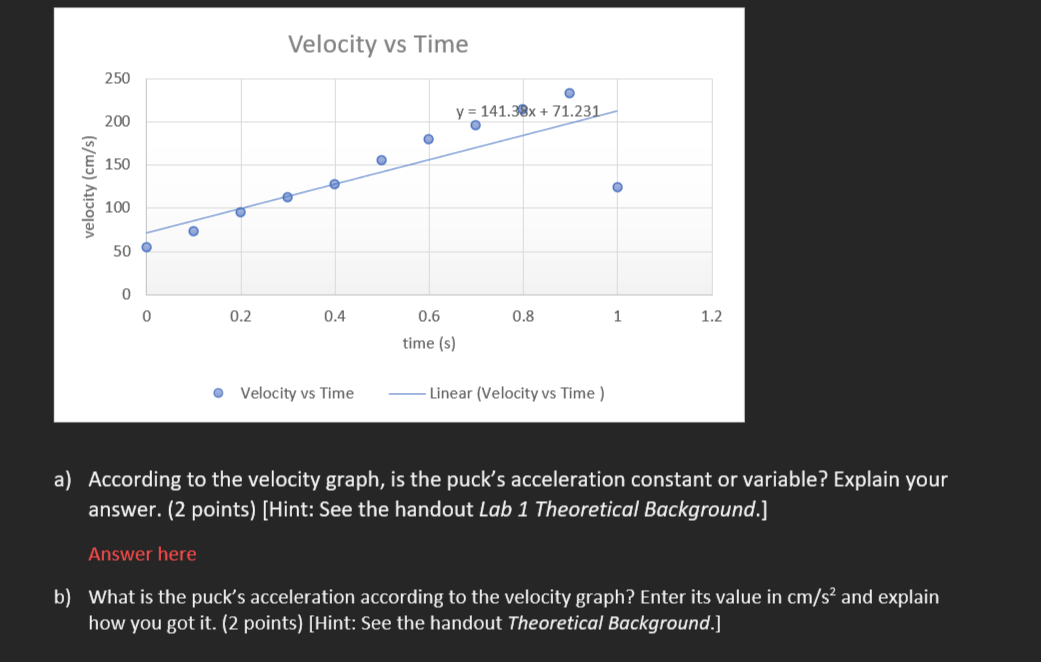
Velocity vs Time 250 O 200 y = 141.38x + 71.231 150 velocity (cm/s) 100 50 0 0 0.2 0.4 0.6 0.8 1.2 time (s)
Step by Step Solution
There are 3 Steps involved in it
Step: 1

Get Instant Access to Expert-Tailored Solutions
See step-by-step solutions with expert insights and AI powered tools for academic success
Step: 2

Step: 3
Ace Your Homework with AI
Get the answers you need in no time with our AI-driven, step-by-step assistance
Get Started
Physics by Example
Authors: W. G. Rees
1st edition
521449758, 521445140, 9780521449755, 978-0521445146