Answered step by step
Verified Expert Solution
Question
1 Approved Answer
Verify, in each case, that the beta estimate is statistically significant. Report and interpret the t-statistic for your alpha estimate. SUMMARY OUTPUT begin{tabular}{l|r} hline multicolumn{2}{|c}{
Verify, in each case, that the beta estimate is statistically significant. Report and interpret the t-statistic for your alpha estimate.
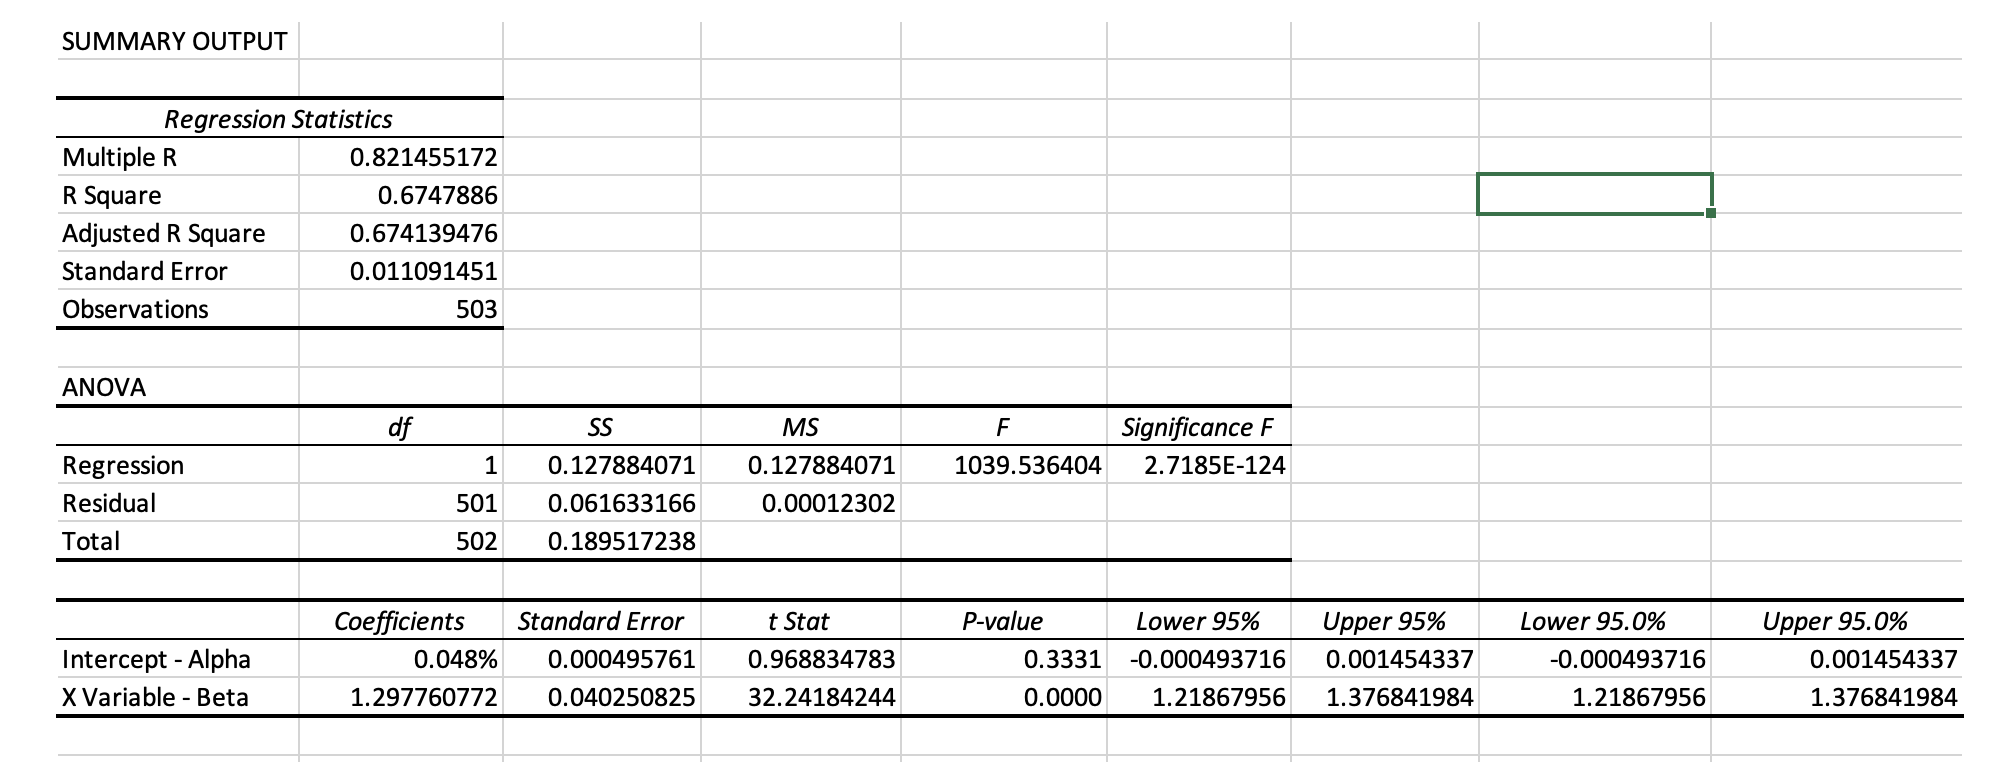
SUMMARY OUTPUT \begin{tabular}{l|r} \hline \multicolumn{2}{|c}{ Regression Statistics } \\ \hline Multiple R & 0.821455172 \\ \hline R Square & 0.6747886 \\ \hline Adjusted R Square & 0.674139476 \\ \hline Standard Error & 0.011091451 \\ \hline Observations & 503 \\ \hline \end{tabular} ANOVA \begin{tabular}{l|r|r|r|r|r} \hline & df & \multicolumn{1}{|c|}{SS} & \multicolumn{1}{c|}{MS} & F & Significance F \\ \hline Regression & 1 & 0.127884071 & 0.127884071 & 1039.536404 & 2.7185E124 \\ \hline Residual & 501 & 0.061633166 & 0.00012302 & & \\ \hline Total & 502 & 0.189517238 & & & \\ \hline \end{tabular} SUMMARY OUTPUT \begin{tabular}{l|r} \hline \multicolumn{2}{|c}{ Regression Statistics } \\ \hline Multiple R & 0.821455172 \\ \hline R Square & 0.6747886 \\ \hline Adjusted R Square & 0.674139476 \\ \hline Standard Error & 0.011091451 \\ \hline Observations & 503 \\ \hline \end{tabular} ANOVA \begin{tabular}{l|r|r|r|r|r} \hline & df & \multicolumn{1}{|c|}{SS} & \multicolumn{1}{c|}{MS} & F & Significance F \\ \hline Regression & 1 & 0.127884071 & 0.127884071 & 1039.536404 & 2.7185E124 \\ \hline Residual & 501 & 0.061633166 & 0.00012302 & & \\ \hline Total & 502 & 0.189517238 & & & \\ \hline \end{tabular}
Step by Step Solution
There are 3 Steps involved in it
Step: 1
Get Instant Access to Expert-Tailored Solutions
See step-by-step solutions with expert insights and AI powered tools for academic success
Step: 2
Step: 3
Ace Your Homework with AI
Get the answers you need in no time with our AI-driven, step-by-step assistance
Get Started