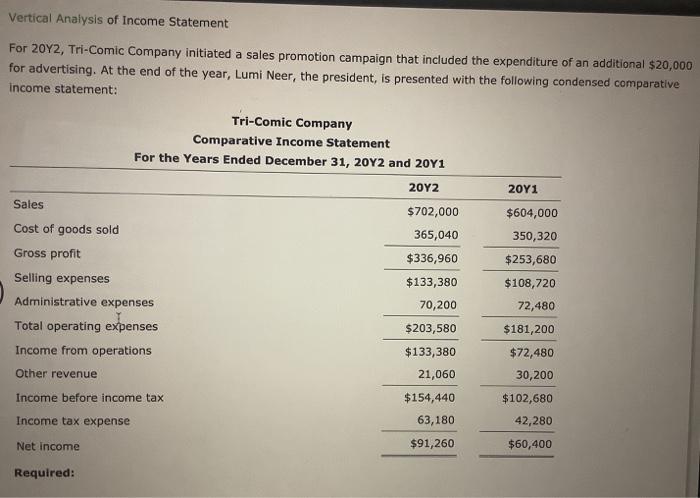
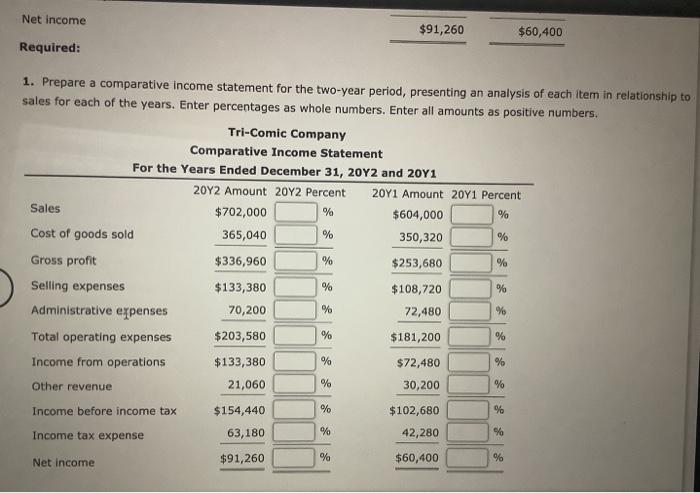
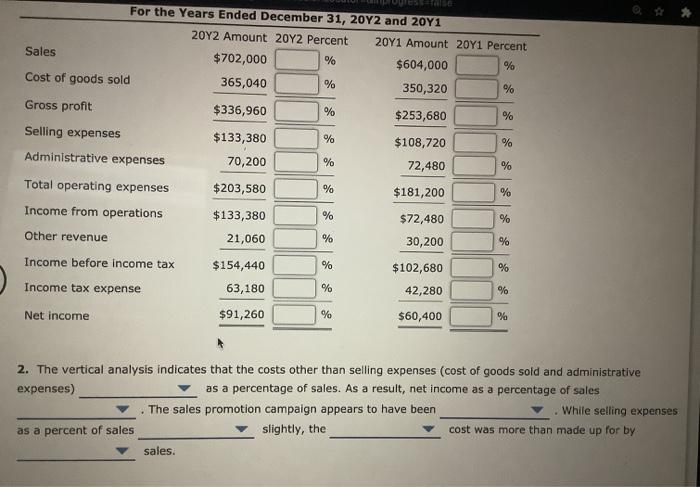
Vertical Analysis of Income Statement For 20Y2, Tri-Comic Company initiated a sales promotion campaign that included the expenditure of an additional $20,000 for advertising. At the end of the year, Lumi Neer, the president, is presented with the following condensed comparative income statement: Tri-Comic Company Comparative Income Statement For the Years Ended December 31, 20Y2 and 2041 20Y2 2011 Sales $702,000 $604,000 Cost of goods sold 365,040 350,320 Gross profit $336,960 $253,680 Selling expenses $133,380 $108,720 Administrative expenses 70,200 72,480 Total operating expenses $203,580 $181,200 Income from operations $133,380 $72,480 Other revenue 21,060 30,200 Income before income tax $154,440 $102,680 Income tax expense 63,180 42,280 $91,260 $60,400 Net income Required: Net income $91,260 $60,400 Required: 1. Prepare a comparative income statement for the two-year period, presenting an analysis of each item in relationship to sales for each of the years. Enter percentages as whole numbers. Enter all amounts as positive numbers. Tri-Comic Company Comparative Income Statement For the Years Ended December 31, 20Y2 and 2041 20Y2 Amount 20Y2 Percent 2011 Amount 20Y1 Percent Sales $702,000 % $604,000 % Cost of goods sold 365,040 % 350,320 % Gross profit $336,960 % $253,680 % Selling expenses $133,380 % $108,720 % Administrative expenses 70,200 % 72,480 % Total operating expenses $203,580 % $181,200 % Income from operations $133,380 % $72,480 % Other revenue 21,060 % 30,200 % $154,440 % Income before income tax $102,680 % 63,180 % Income tax expense 42,280 % $91,260 % $60,400 Net income % For the Years Ended December 31, 2012 and 20Y1 2012 Amount 20Y2 Percent 20Y1 Amount 20Y1 Percent Sales $702,000 % $604,000 % Cost of goods sold 365,040 % 350,320 % $336,960 % Gross profit Selling expenses % $133,380 % $253,680 $108,720 72,480 % Administrative expenses 70,200 % % Total operating expenses $203,580 % $181,200 % Income from operations % % $133,380 21,060 Other revenue % % Income before income tax $72,480 30,200 $102,680 42,280 % % Income tax expense $154,440 63,180 $91,260 % % Net Income % $60,400 % 2. The vertical analysis indicates that the costs other than selling expenses (cost of goods sold and administrative expenses) as a percentage of sales. As a result, net income as a percentage of sales The sales promotion campaign appears to have been While selling expenses as a percent of sales slightly, the cost was more than made up for by sales