Vertical & Horizontal Analysis 2018 & 2017. Conduct the following vertical and horizontal analyses and write a brief summary of findings related to these analyses. If you notice something of particular interest in the vertical analysis, refer to the horizontal analysis that supports or explains that finding (and visa versa). You may use EXCEL or a similar program for this question. That is, I would suggest you recreate the financial statements in an Excel tab or tabs, and make the computations directly on that file.
- First, describe the purposes of conducting a vertical analysis and a horizontal analysis AND how they are computed (do this using one formula for a vertical analysis and one for a horizontal analysis). Then conduct the following:
- Horizontal analysis of the income statement for 2018.
- Horizontal analysis of the balance sheet for 2018.
- Vertical analysis of the income statement using Total Revenues as a constant for 2018 and 2017.
- Vertical analysis of the balance sheet using Total Assets as constant for 2018 and 2017.
- Summarize the primary findings of your analyses.
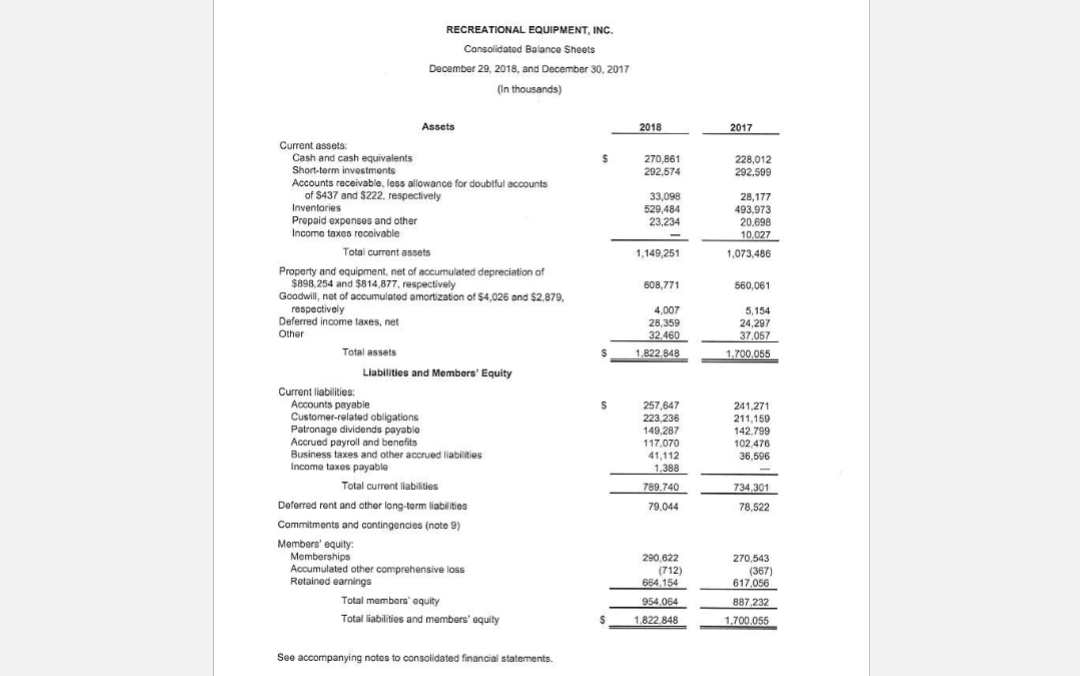
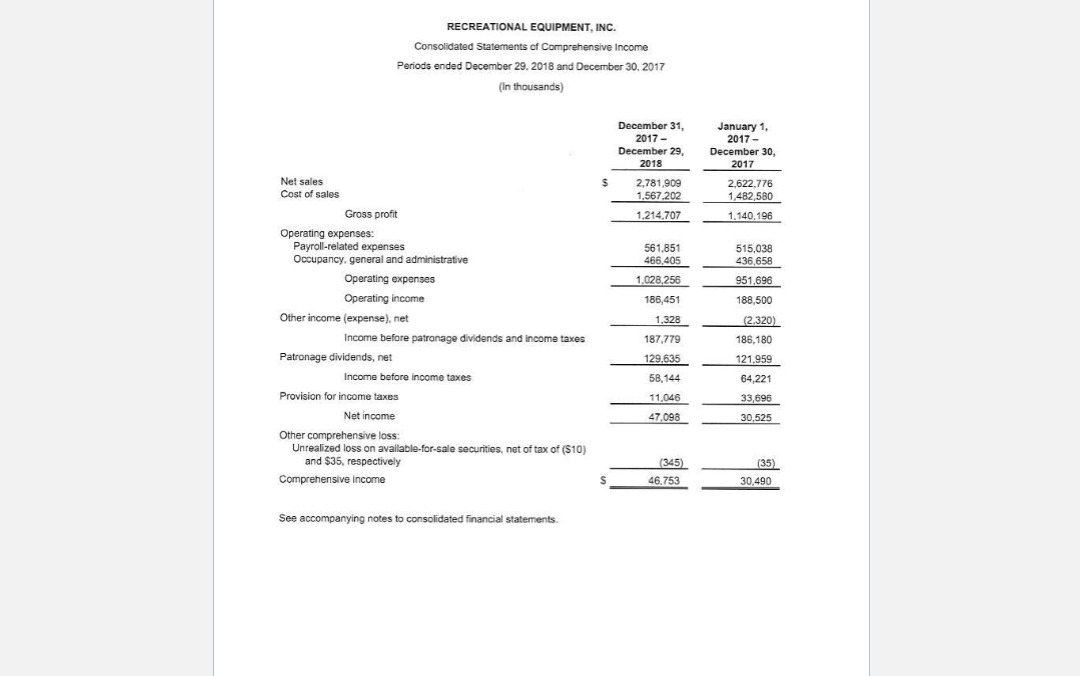
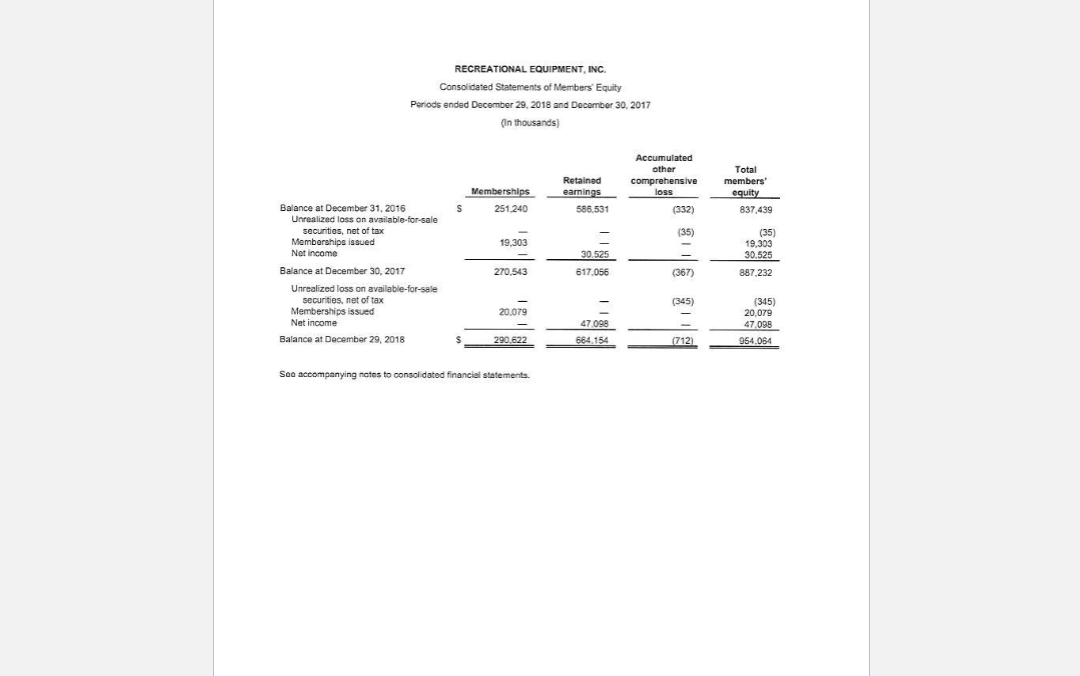
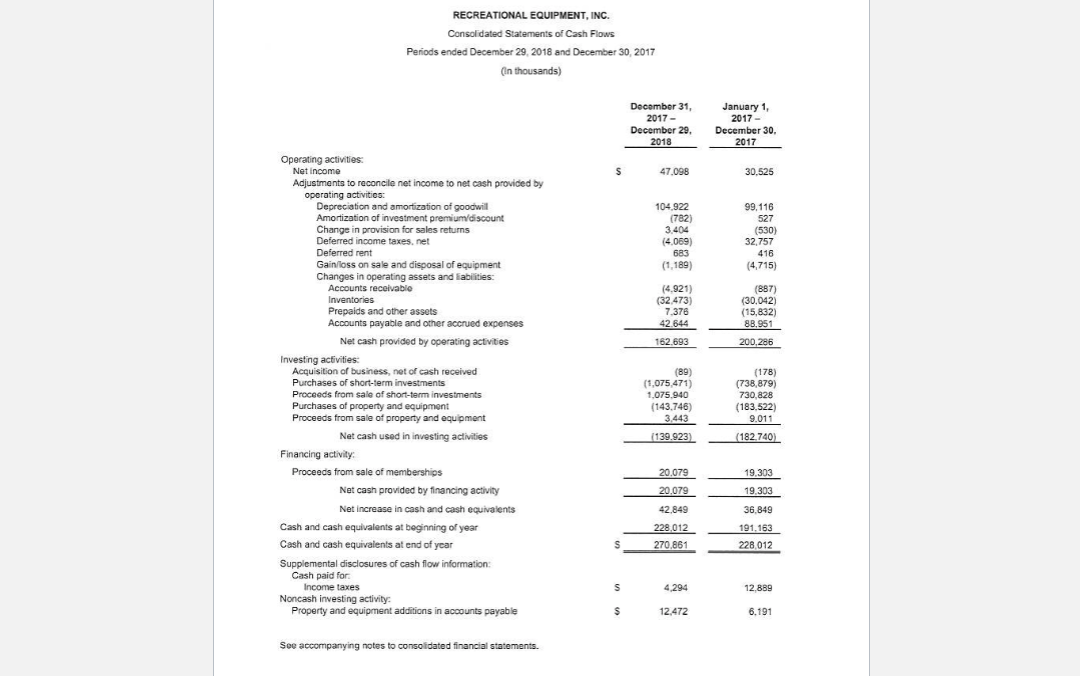
RECREATIONAL EQUIPMENT, INC. , Consolidated Balance Sheets December 29, 2018, and December 30, 2017 , (In thousands) 2018 2017 $ 270,861 292,574 228,012 292,599 33,098 529,484 23,234 1932 28,177 493,973 20.698 10,027 1,073,486 1,149,251 608,771 560,061 4,007 28,359 32,460 1.822.848 5,154 24,297 37,057 1.700,055 Assets Current assets: Cash and cash equivalents Short-term investments Accounts receivable less allowance for doubtful accounts of S437 and 5222, respectively Inventories Prepaid expenses and other Income taxes receivable Total current assets Property and equipment, net of accumulated depreciation of $898,254 and $814,877, respectively Goodwill, not of accumulated amortization of $4,026 and $2.879, respectively Deferred income taxes, net Other Total assets Liabilities and Members' Equity Current liabilities: Accounts payable Customer-related obligations Patronage dividends payablo Accrued payroll and benefits Business taxes and other accrued liabilities Income taxes payable Total current liabilities Deferred ront and other long term liabilities - Commitments and contingencies (note 9) Members' equity: ' Memberships Accumulated other comprehensive loss Retained earnings Total members' equity Total liabilities and members' equity S 257,647 223,236 149,287 117,070 41,112 1,388 789.740 79,044 241,271 211,150 142.799 102 476 36,506 734,301 78,522 1942 290 622 (712) 664.154 954,064 270,543 (367 617.056 887,232 1.700.055 1.822.848 See accompanying notes to consolidated financial statements. RECREATIONAL EQUIPMENT, INC. Consolidated Statements of Comprehensive Income Periods ended December 29, 2018 and December 30, 2017 (In thousands) December 31, 2017 - December 29, 2018 January 1. 2017- December 30, 2017 2.622.776 1,482,580 $ 2,781,909 1,567.202 1.214,707 1.140.196 561.851 466,405 1,028,256 515,038 436,658 951,696 186,451 188,500 1,328 Net sales Cost of sales Gross profit Operating expenses Payroll-related expenses Occupancy, general and administrative Operating expenses Operating income Other income (expense), net Income before patronage dividends and income taxes Patronage dividends, net Income before income taxes Provision for income taxes Net income Other comprehensive loss: Unrealized loss on available-for-sale securities, net of tax of (510) and $35, respectively Comprehensive income (2.320) 186,180 187.779 129.635 58,144 121,959 64,221 11,046 33,696 47,098 30,525 (345) 46.753 (35) 30,490 S See accompanying notes to consolidated financial statements. RECREATIONAL EQUIPMENT, INC. , . Consolidated Statements of Members Equity Periods ended December 29, 2018 and December 30, 2017 (In thousands) Total Accumulated other comprehensive loss Retained earnings 586.531 members equity Memberships S 251.240 (332) 837.439 (35) 19,303 - Balance at December 31, 2016 Unrealized loss on available for sale securities, not of tax Memberships issued Not income Balance at December 30, 2017 Unrealized loss on available-for-sale securities, net of tax Memberships issued Net income Balance at December 29, 2018 , 30.525 617.056 (35) 19,303 30.525 887,232 270.543 (367) (345) 20.079 47 098 664,154 (345) 20,079 47,098 954,064 S 290.622 ) (712) See accompanying notes to consolidated financial statements. . RECREATIONAL EQUIPMENT, INC. Consolidated Statements of Cash Flows Periods ended December 29, 2018 and December 30, 2017 , (In thousands) ) December 31, 2017- December 29 2018 January 1, 2017- December 30, 2017 s 47,098 30,525 104.922 (782) 3,404 4 (4.069) 683 (1,189) 99.116 527 (530) 32,757 416 (4.715) (4.921) (32.473) 7.376 42.644 (887) (30.042) (15,832) 88.951 200.286 162.693 Operating activities: Net income Adjustments to reconcile net income to net cash provided by operating activities: Depreciation and amortization of goodwill Amortization of investment premium/discount Change in provision for sales returns Deferred income taxes, net Deferred rent Gain loss on sale and disposal of equipment Changes in operating assets and abilities: Accounts receivable Inventories Prepaids and other assets Accounts payable and other accrued expenses Net cash provided by operating activities Investing activities Acquisition of business, net of cash received Purchases of short-term investments Proceeds from sale of short-term investments Purchases of property and equipment Proceeds from sale of property and equipment Net cash used in investing activities Financing activity Proceeds from sale of memberships Net cash provided by financing activity Net increase in cash and cash equivalents Cash and cash equivalents at beginning of year Cash and cash equivalents at end of year Supplemental disclosures of cash flow information: Cash paid for Income taxes Noncash investing activity Property and equipment additions in accounts payable (89) ( (1,075,471) 1.075.940 (143.746) ) 3.443 (139.923) (178) (738,879) 730,828 (183,522) 9.011 (182.740) Las 20.079 19.303 19.303 20.079 42.849 228,012 270,861 36.849 191.163 228,012 S s 4.294 12.889 $ 12.472 6.191 See accompanying notes to consolidated financial statements. RECREATIONAL EQUIPMENT, INC. , Consolidated Balance Sheets December 29, 2018, and December 30, 2017 , (In thousands) 2018 2017 $ 270,861 292,574 228,012 292,599 33,098 529,484 23,234 1932 28,177 493,973 20.698 10,027 1,073,486 1,149,251 608,771 560,061 4,007 28,359 32,460 1.822.848 5,154 24,297 37,057 1.700,055 Assets Current assets: Cash and cash equivalents Short-term investments Accounts receivable less allowance for doubtful accounts of S437 and 5222, respectively Inventories Prepaid expenses and other Income taxes receivable Total current assets Property and equipment, net of accumulated depreciation of $898,254 and $814,877, respectively Goodwill, not of accumulated amortization of $4,026 and $2.879, respectively Deferred income taxes, net Other Total assets Liabilities and Members' Equity Current liabilities: Accounts payable Customer-related obligations Patronage dividends payablo Accrued payroll and benefits Business taxes and other accrued liabilities Income taxes payable Total current liabilities Deferred ront and other long term liabilities - Commitments and contingencies (note 9) Members' equity: ' Memberships Accumulated other comprehensive loss Retained earnings Total members' equity Total liabilities and members' equity S 257,647 223,236 149,287 117,070 41,112 1,388 789.740 79,044 241,271 211,150 142.799 102 476 36,506 734,301 78,522 1942 290 622 (712) 664.154 954,064 270,543 (367 617.056 887,232 1.700.055 1.822.848 See accompanying notes to consolidated financial statements. RECREATIONAL EQUIPMENT, INC. Consolidated Statements of Comprehensive Income Periods ended December 29, 2018 and December 30, 2017 (In thousands) December 31, 2017 - December 29, 2018 January 1. 2017- December 30, 2017 2.622.776 1,482,580 $ 2,781,909 1,567.202 1.214,707 1.140.196 561.851 466,405 1,028,256 515,038 436,658 951,696 186,451 188,500 1,328 Net sales Cost of sales Gross profit Operating expenses Payroll-related expenses Occupancy, general and administrative Operating expenses Operating income Other income (expense), net Income before patronage dividends and income taxes Patronage dividends, net Income before income taxes Provision for income taxes Net income Other comprehensive loss: Unrealized loss on available-for-sale securities, net of tax of (510) and $35, respectively Comprehensive income (2.320) 186,180 187.779 129.635 58,144 121,959 64,221 11,046 33,696 47,098 30,525 (345) 46.753 (35) 30,490 S See accompanying notes to consolidated financial statements. RECREATIONAL EQUIPMENT, INC. , . Consolidated Statements of Members Equity Periods ended December 29, 2018 and December 30, 2017 (In thousands) Total Accumulated other comprehensive loss Retained earnings 586.531 members equity Memberships S 251.240 (332) 837.439 (35) 19,303 - Balance at December 31, 2016 Unrealized loss on available for sale securities, not of tax Memberships issued Not income Balance at December 30, 2017 Unrealized loss on available-for-sale securities, net of tax Memberships issued Net income Balance at December 29, 2018 , 30.525 617.056 (35) 19,303 30.525 887,232 270.543 (367) (345) 20.079 47 098 664,154 (345) 20,079 47,098 954,064 S 290.622 ) (712) See accompanying notes to consolidated financial statements. . RECREATIONAL EQUIPMENT, INC. Consolidated Statements of Cash Flows Periods ended December 29, 2018 and December 30, 2017 , (In thousands) ) December 31, 2017- December 29 2018 January 1, 2017- December 30, 2017 s 47,098 30,525 104.922 (782) 3,404 4 (4.069) 683 (1,189) 99.116 527 (530) 32,757 416 (4.715) (4.921) (32.473) 7.376 42.644 (887) (30.042) (15,832) 88.951 200.286 162.693 Operating activities: Net income Adjustments to reconcile net income to net cash provided by operating activities: Depreciation and amortization of goodwill Amortization of investment premium/discount Change in provision for sales returns Deferred income taxes, net Deferred rent Gain loss on sale and disposal of equipment Changes in operating assets and abilities: Accounts receivable Inventories Prepaids and other assets Accounts payable and other accrued expenses Net cash provided by operating activities Investing activities Acquisition of business, net of cash received Purchases of short-term investments Proceeds from sale of short-term investments Purchases of property and equipment Proceeds from sale of property and equipment Net cash used in investing activities Financing activity Proceeds from sale of memberships Net cash provided by financing activity Net increase in cash and cash equivalents Cash and cash equivalents at beginning of year Cash and cash equivalents at end of year Supplemental disclosures of cash flow information: Cash paid for Income taxes Noncash investing activity Property and equipment additions in accounts payable (89) ( (1,075,471) 1.075.940 (143.746) ) 3.443 (139.923) (178) (738,879) 730,828 (183,522) 9.011 (182.740) Las 20.079 19.303 19.303 20.079 42.849 228,012 270,861 36.849 191.163 228,012 S s 4.294 12.889 $ 12.472 6.191 See accompanying notes to consolidated financial statements