

Answered step by step
Verified Expert Solution
Question
1 Approved Answer
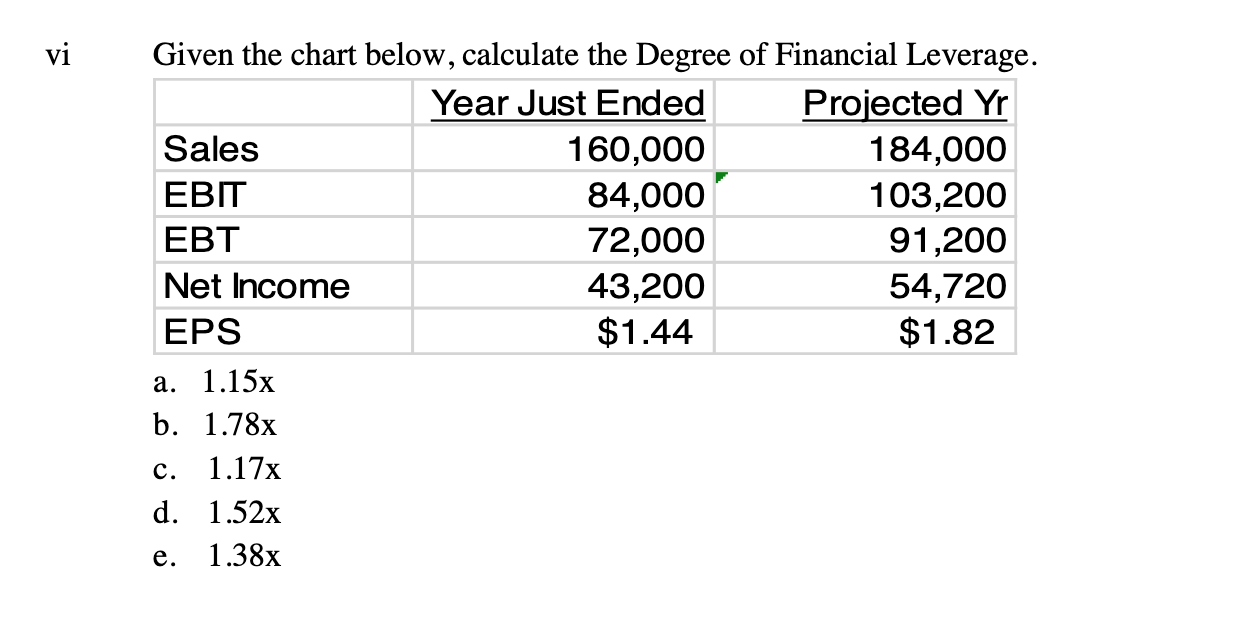
vi Given the chart below, calculate the Degree of Financial Leverage. Year Just Ended Projected Yr Sales 160,000 184,000 EBIT 84,000 103,200 EBT 72,000 91,200
Step by Step Solution
There are 3 Steps involved in it
Step: 1

Get Instant Access to Expert-Tailored Solutions
See step-by-step solutions with expert insights and AI powered tools for academic success
Step: 2

Step: 3
Ace Your Homework with AI
Get the answers you need in no time with our AI-driven, step-by-step assistance
Get Started
Advanced Finance Theories
Authors: Ser-Huang Poon
1st Edition
9814460370, 978-9814460378