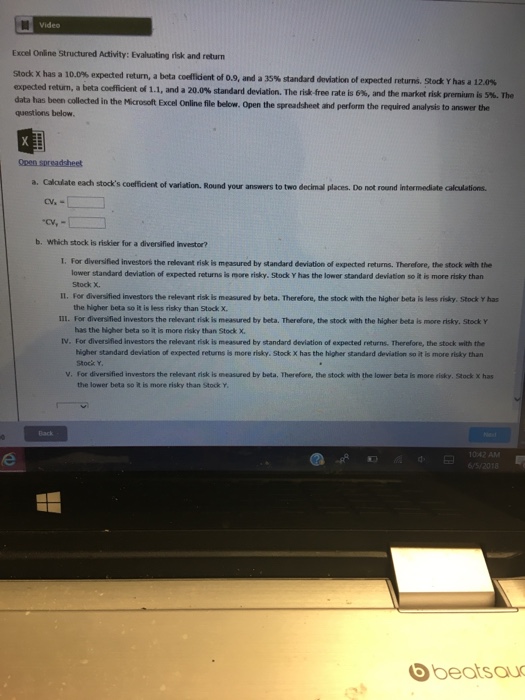
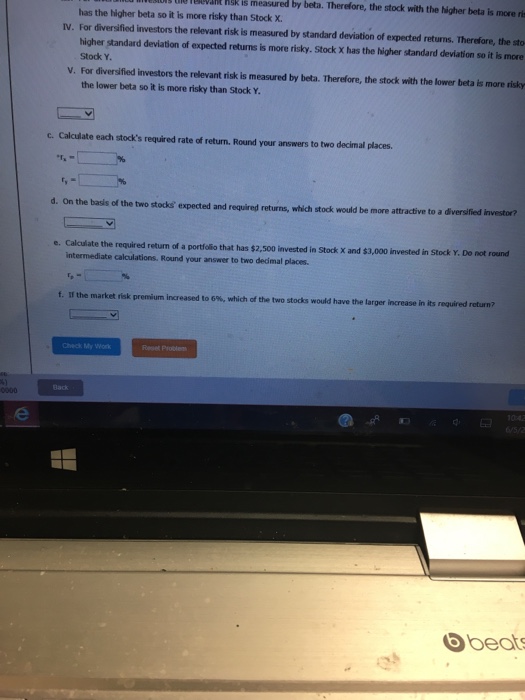
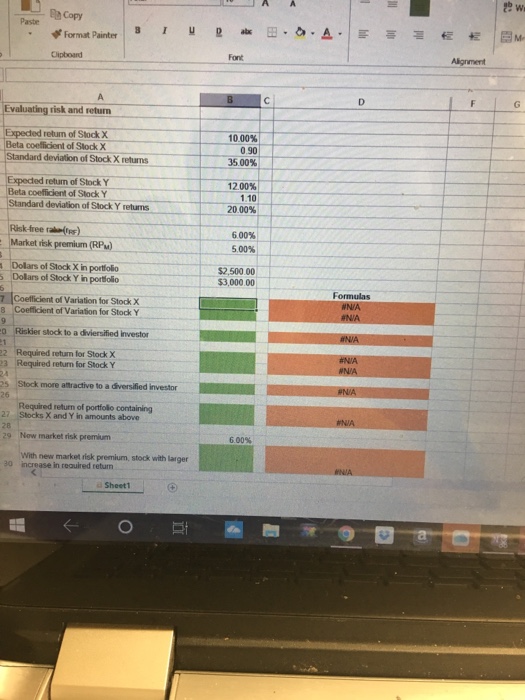
Video Excel Online Structured Activity: Evaluating risk and return Stock X has a 10.0% expected return, a beta data has been collected coeffident of 0.9. and a 35% standard deviation of expected returns. Sok Y has a 12.0% return, a beta coeffident of 1.1, and a 20.0% standard deviation. The risk free rate is 6%, and the market risk premium is 5%. The in the Microsoft Excel Online file below. Open the spreadsheet and perform the required analysis to answer the questions below a. Calaulate eadh stock's coefficient of variation. Round your answers to two decimal places. Do not round intermediate calculations. CV. b. Which stock is riskier for a diversified investor? I. For diversified investors the relevant risk is measured by standard deviation of expected returns. Therefore, the stock with the lower standard deviation of expected returns is more risky. Stock Y has the lower standard deviation so it is more risky than Stock X. II. For diversified investors the relevant risk is measured by beta. Therefore, the stock with the higher beta is less risky. Stock Y has III. For diversified investors the relevant risk is measured by beta. Therefone, the stock with the higher beta is more risky. Stock Y IV. For diversified investors the relevant risk is measured by standard deviation of expected returns. Therefore, the stock with the the higher beta so it is less risky than Stock x. has the higher beta so it is more risky than Stock X. higher standard deviation of expected returns is more risky. Stock X has the higher standard deviation so it is more risky than Stock Y V. for diversified investors the relevant risk is measured by beta. Therefore, the stock with the lower beta is more risky. Stock X has the lower beta so it is more risky than Stock Y 1042 AM 5/2018 2 6beatsau