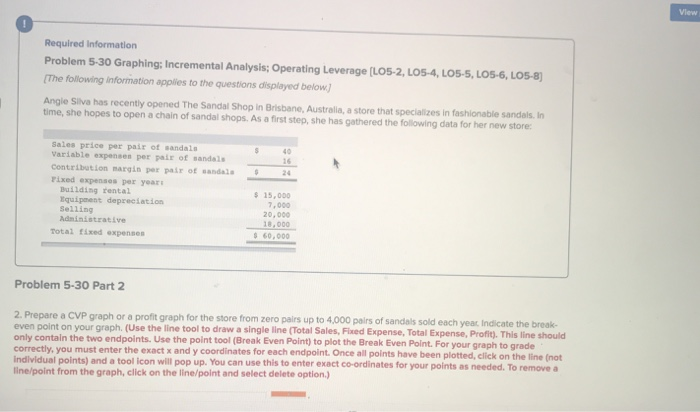
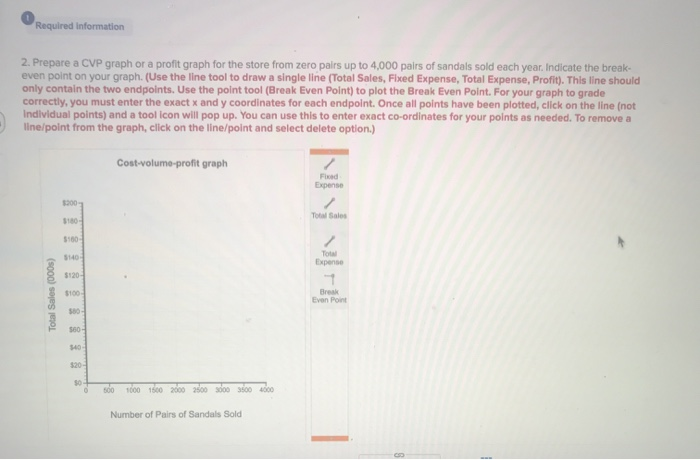
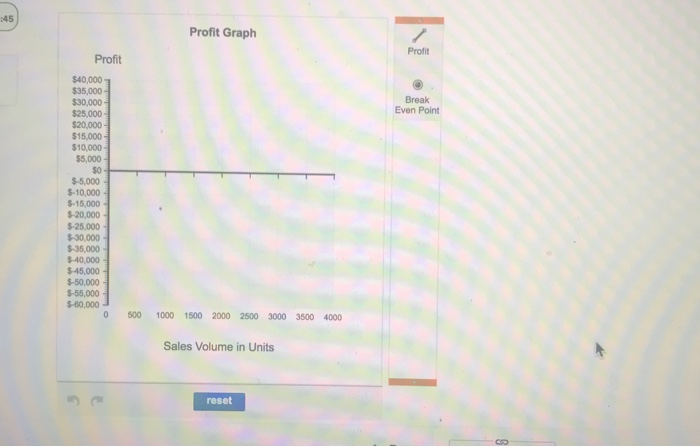
View Required Information Problem 5-30 Graphing: Incremental Analysis: Operating Leverage (LO5-2, L05-4, LO5-5, LO5-6, LO5-8) [The following information applies to the questions displayed below] Angle Silva has recently opened The Sandal Shop in Brisbane, Australia, a store that specializes in fashionable sandals, in time, she hopes to open a chain of sandal shops. As a first step, she has gathered the following data for her new store: $ 40 Sales price per pair of sandals Variable expenses per pair of sandals Contribution margin per pair of sandala Fixed expenses per year Building rental Equipment depreciation Selling Administrative Total fixed expenses $ 15,000 7,000 20,000 18.000 $ 60,000 Problem 5-30 Part 2 2. Prepare a CVP graph or a profit graph for the store from zero pairs up to 4,000 pairs of sandals sold each year. Indicate the break- even point on your graph. (Use the line tool to draw a single line (Total Sales, Fixed Expense, Total Expense, Profit). This line should only contain the two endpoints. Use the point tool (Break Even Point) to plot the Break Even Point. For your graph to grade correctly, you must enter the exact x and y coordinates for each endpoint. Once all points have been plotted, click on the line (not Individual points) and a tool icon will pop up. You can use this to enter exact co-ordinates for your points as needed. To remove a line/point from the graph, click on the line/point and select delete option) Required information 2. Prepare a CVP graph or a profit graph for the store from zero pairs up to 4,000 pairs of sandals sold each year. Indicate the break- even point on your graph. (Use the line tool to draw a single line (Total Sales, Fixed Expense, Total Expense, Profit). This tine should only contain the two endpoints. Use the point tool (Break Even Point) to plot the Break Even Point. For your graph to grade correctly, you must enter the exact x and y coordinates for each endpoint. Once all points have been plotted, click on the line (not Individual points) and a tool icon will pop up. You can use this to enter exact co-ordinates for your points as needed. To remove a line/point from the graph, click on the line/point and select delete option.) Cost-volume-profit graph Fred Expense 3200 Tot Sales $180 $100 $120 Total Sales (000) To Expense 17 Break Even Point $100 560- 520 $0 500 1000 1500 2000 200 000 100 100 Number of Pairs of Sandals Sold :45 Profit Graph Profit Profit Break Even Point $40,000 $35,000 $30,000 $25,000 $20,000 $15,000 $10,000 $5,000 SO $-5,000 $-10,000 $-15,000 $-20,000 S-25,000 $-30,000 $ 35,000 $ 40,000 $-45,000 $-50,000 $-55,000 $-80,000 0 500 1000 1500 2000 2500 3000 3500 4000 Sales Volume in Units reset