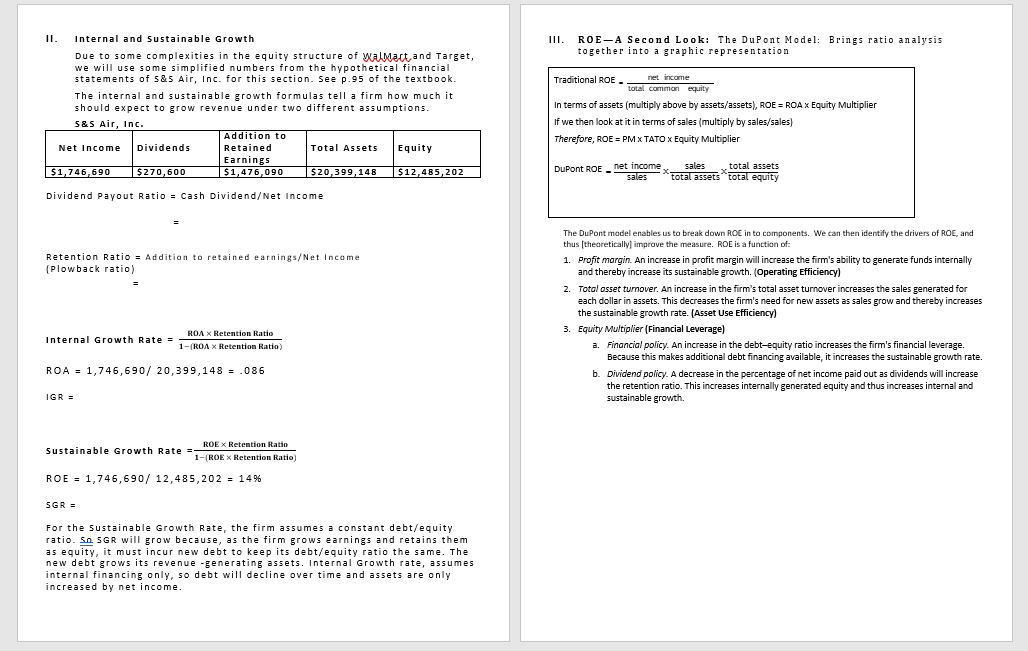
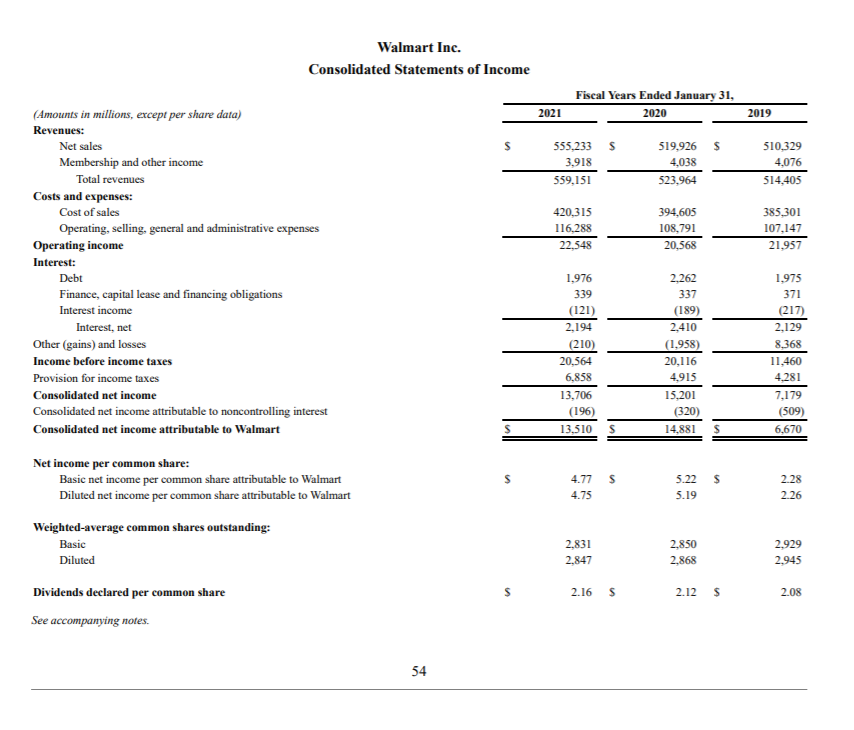
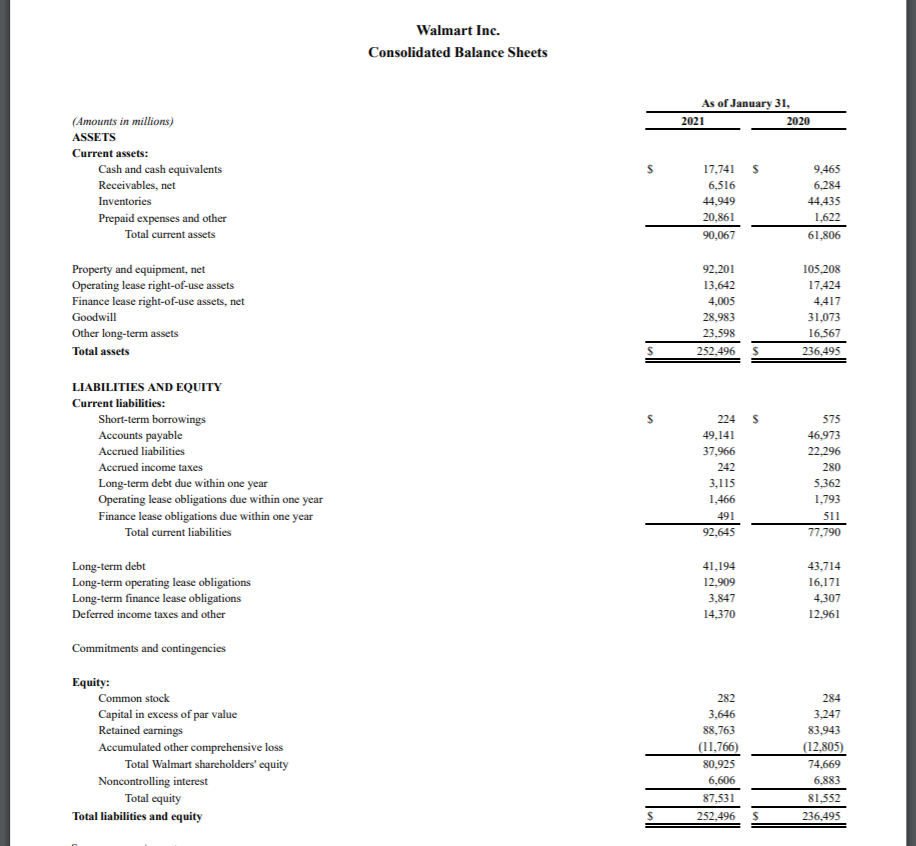
View the Ch. 3 Introductory Video from the "Watch" portion of the Chapter 3 Agenda page. Use the financial statements for Walmart to calculate the ratios described in Part I A-E of your Ch. 3 Outline. Include in your calculation the numbers necessary to complete each factor in the formula and do the necessary calculation. You will upload a Word document or pdf of the completed pages in Canvas by the due date . (If submitting a pdf, please scan the document into one pdf, using Adobe Scan or a similar app. (Please do not submit jpeg files.) Your submission will be graded for completeness, not accuracy. It is worth up to 25 points. 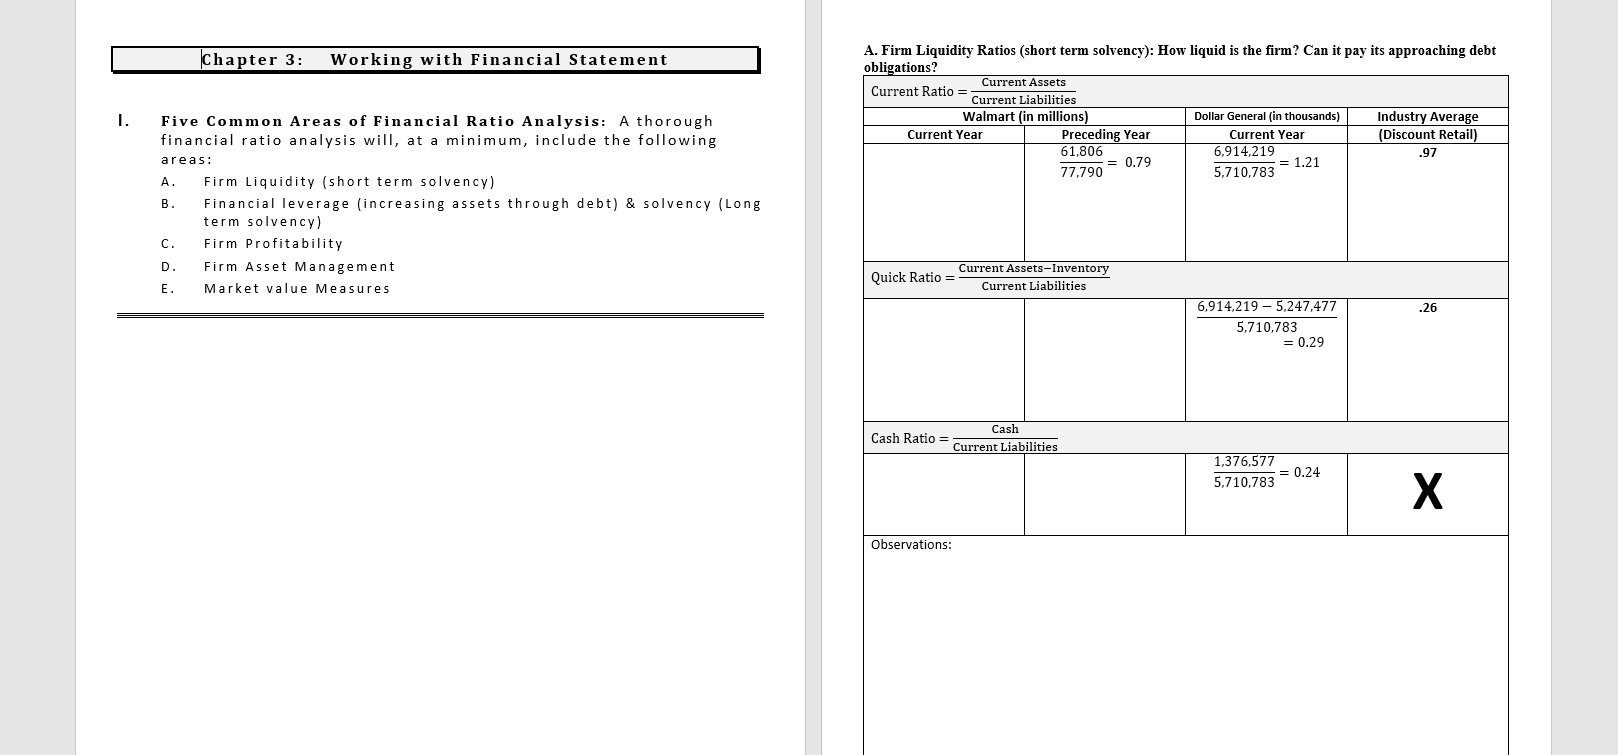
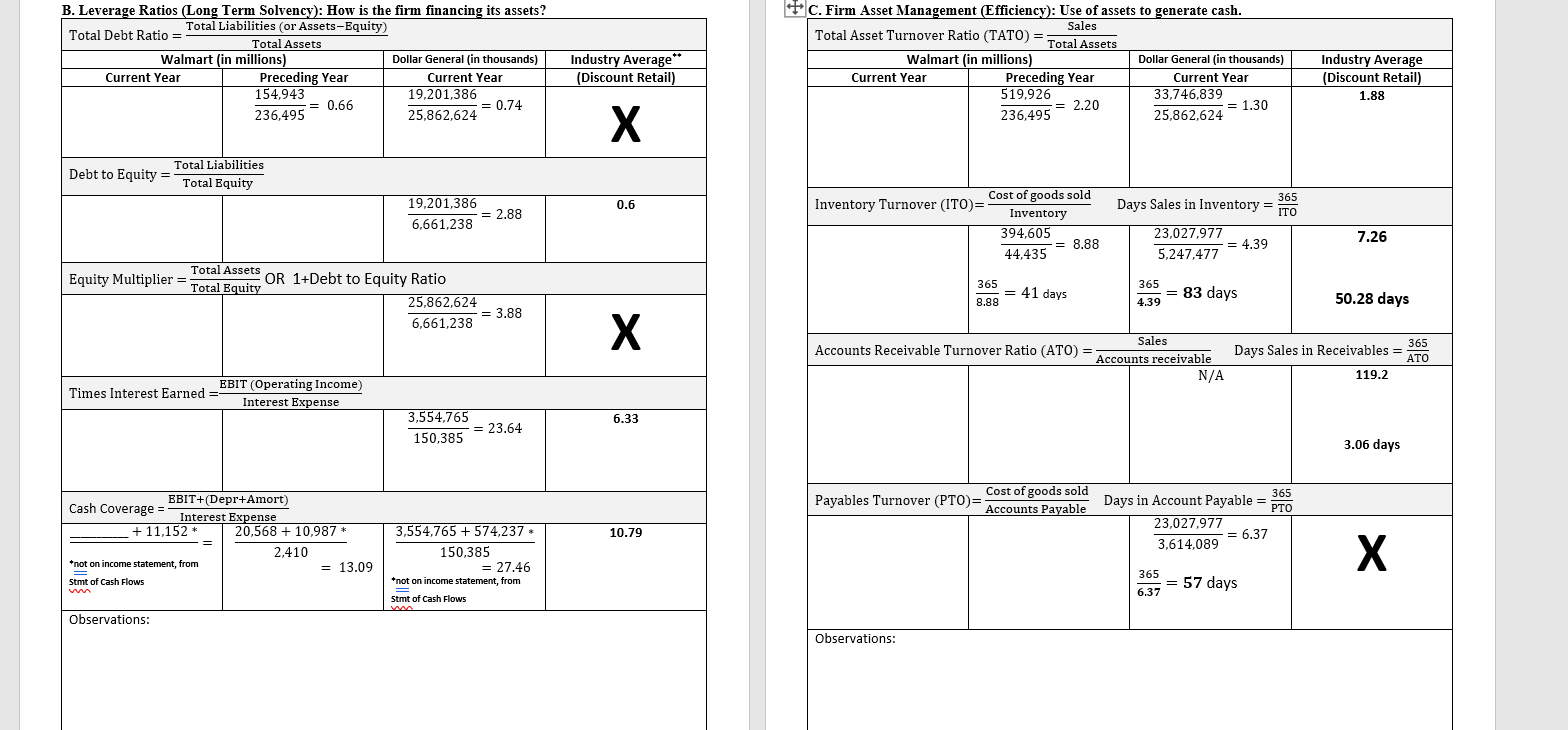
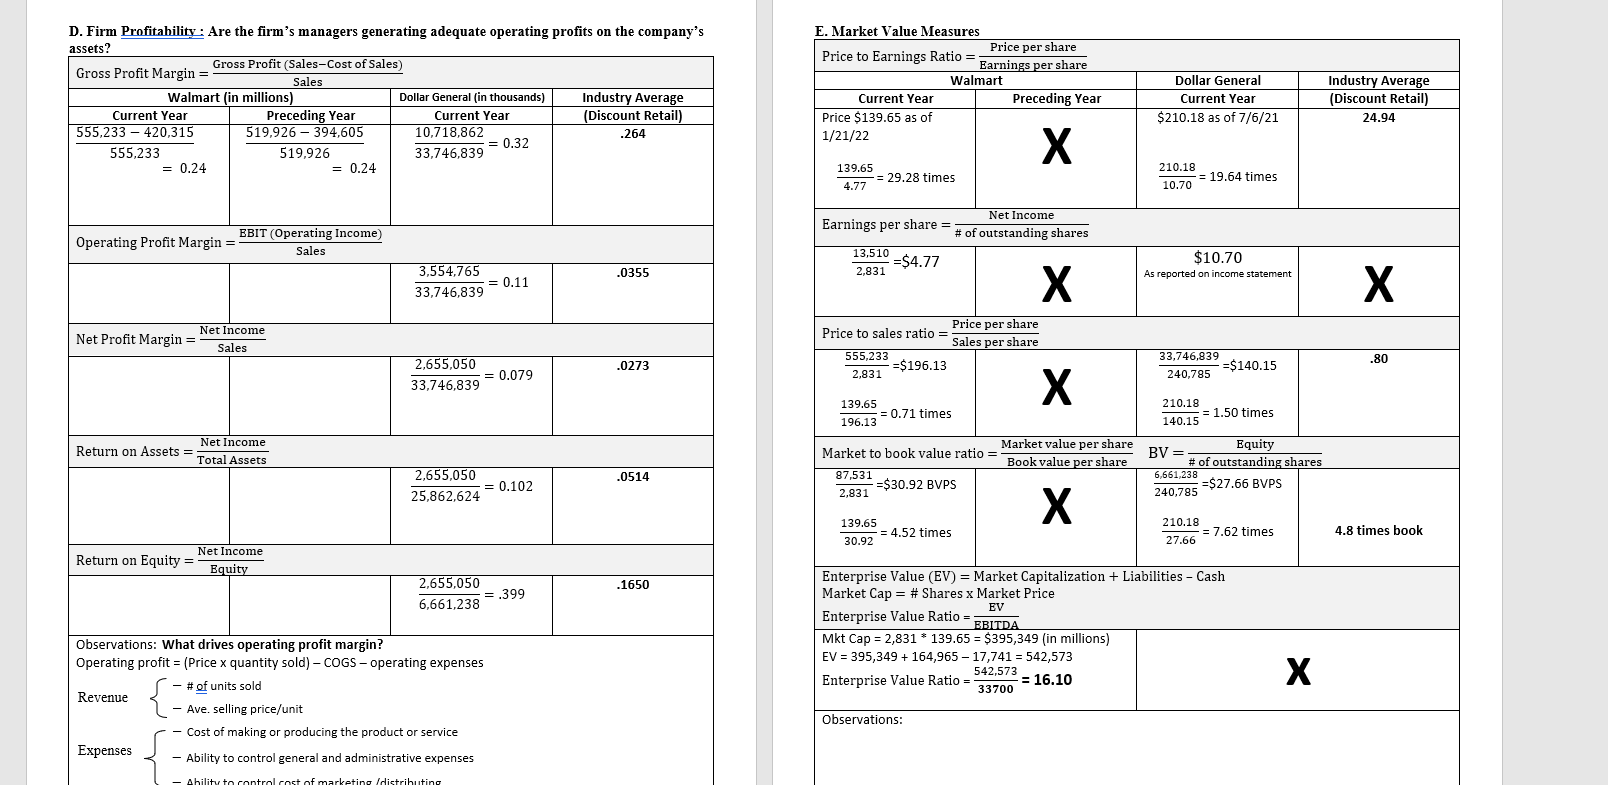
Chapter 3: Working with Financial Statement A. Firm Liquidity Ratios (short term solvency): How liquid is the firm? Can it pay its approaching debt obligations? Current Assets Current Ratio Current Liabilities Walmart (in millions) Dollar General (in thousands) Industry Average Current Year Preceding Year Current Year (Discount Retail) 61,806 6,914,219 .97 0.79 = 1.21 77,790 5.710.783 1. Five Common Areas of Financial Ratio Analysis: A thorough financial ratio analysis will, at a minimum, include the following areas: A. Firm Liquidity (short term solvency) Financial leverage (increasing assets through debt) & solvency (Long term solvency) C. Firm Profitability D. Firm Asset Management E. Market value Measures B Current Assets-Inventory Quick Ratio = Current Liabilities .26 6,914,219-5,247,477 5,710,783 = 0.29 Cash Cash Ratio = Current Liabilities 1,376,577 = 0.24 5,710.783 Observations: B. Leverage Ratios (Long Term Solvency): How is the firm financing its assets? Total Liabilities (or Assets-Equity) Total Debt Ratio = Total Assets Walmart (in millions) Dollar General (in thousands) Current Year Preceding Year Current Year 154,943 19,201,386 = 0.66 = 0.74 236,495 25,862,624 Industry Average** (Discount Retail) + C. Firm Asset Management (Efficiency): Use of assets to generate cash. Sales Total Asset Turnover Ratio (TATO) = Total Assets Walmart (in millions) Dollar General (in thousands) Current Year Preceding Year Current Year 519,926 33,746,839 236,495 25,862,624 Industry Average (Discount Retail) 1.88 = 2.20 = 1.30 Total Liabilities Debt to Equity = Total Equity 0.6 19,201,386 = 2.88 6,661,238 Cost of goods sold Inventory Turnover (ITO)= Inventory 394,605 = 8.88 44,435 365 Days Sales in Inventory = ITO 23,027,977 = 4.39 5,247,477 7.26 Total Assets Equity Multiplier = OR 1+Debt to Equity Ratio Total Equity 25,862,624 6,661,238 365 = 41 days 8.88 365 = 83 days 4.39 50.28 days 3.88 Days Sales in Receivables Sales Accounts Receivable Turnover Ratio (ATO) = Accounts receivable N/A 365 ATO 119.2 Times Interest Earned EBIT (Operating Income) Interest Expense 6.33 3,554,765 = 23.64 150.385 3.06 days Payables Turnover (PTO)= Cost of goods sold Accounts Payable Days in Account Payable = 365 PTO 23,027,977 = 6.37 3,614,089 EBIT+(Depr+Amort) Cash Coverage Interest Expense + 11.152 20,568 + 10.987 * 2,410 *not on income statement, from --- = 13.09 Stmt of Cash Flows 10.79 3,554,765 + 574,237 150,385 = 27.46 *not on income statement, from = Stmt of Cash Flows 365 6.37 = 57 days Observations: Observations: D. Firm Profitability: Are the firm's managers generating adequate operating profits on the company's assets? Gross Profit Margin = Gross Profit (Sales-Cost of Sales) Sales Walmart (in millions) Dollar General (in thousands) Industry Average Current Year Preceding Year Current Year (Discount Retail) 555,233 - 420,315 519.926 - 394,605 10.718,862 .264 = 0.32 555,233 519,926 33.746.839 = 0.24 = 0.24 E. Market Value Measures Price per share Price to Earnings Ratio = Earnings per share Walmart Current Year Preceding Year Price $139.65 as of 1/21/22 Dollar General Current Year $210.18 as of 7/6/21 Industry Average (Discount Retail) 24.94 X 139.65 = 29.28 times 4.77 210.18 10.70 = 19.64 times Earnings per share Net Income # of outstanding shares Operating Profit Margin = EBIT (Operating Income) Sales 13,510 =$4.77 2,831 $10.70 As reported on income statement .0355 3,554,765 = 0.11 33,746,839 Net Income Net Profit Margin= Sales Price to sales ratio = Price per share Sales per share 555,233 =$196.13 2,831 .80 .0273 2,655,050 33.746.839 33,746,839 =$140.15 240,785 0.079 X 139.65 = 0.71 times 196.13 210.18 = 1.50 times 140.15 Net Income Return on Assets = Total Assets Market to book value ratio = Market value per share ok value per share 87,531 =$30.92 BVPS .0514 2,655,050 = 0.102 25,862,624 Equity BV= # of outstanding shares 6,661,238 =$27.66 BVPS 240,785 2,831 139.65 = 4.52 times 30.92 210.18 = 7.62 times 4.8 times book 27.66 Net Income Return on Equity = Equity .1650 2.655,050 = .399 6,661,238 Enterprise Value (EV) = Market Capitalization + Liabilities - Cash Market Cap = # Shares x Market Price EV Enterprise Value Ratio = EBITDA Mkt Cap = 2,831 * 139.65 = $395,349 (in millions) EV = 395,349 +164,965 17,741 = 542,573 542,573 Enterprise Value Ratio = = 16.10 33700 Observations: What drives operating profit margin? Operating profit = (Price x quantity sold) - COGS - operating expenses - # of units sold Revenue Ave. selling price/unit - Cost of making or producing the product or service Expenses Ability to control general and administrative expenses Observations: Ability to control cost of marketing Idistributing III. ROE-A Second Look: The DuPont Model: Brings ratio analysis together into a graphic representation Internal and sustainable Growth Due to some complexities in the equity structure of Walmart and Target, we will use some simplified numbers from the hypothetical financial statements of 5&Air, inc. for this section. See p.95 of the textbook. The internal and sustainable growth formulas tell a firm how much it should expect to grow revenue under two different assumptions. S&S Air, Inc. 585 Addition to Net Income Dividends Retained Total Assets Equity Earnings 51,746,690 $ 270,600 $1,476,090 $20,399,148 $12,485,202 Traditional ROE net income total common equity In terms of assets (multiply above by assets/assets), ROE = ROA X Equity Multiplier If we then look at it in terms of sales (multiply by sales/sales) Therefore, ROE = PM X TATO X Equity Multiplier DuPont ROE net income sales sales total assets total assets total equity Dividend Payout Ratio = Cash Dividend/Net Income Retention Ratio - Addition to retained earnings/Net Income (Plowback ratio) The DuPont madel enables us to break down ROE in to components. We can then identify the drivers of ROE, and thus (theoretically improve the measure. ROE is a function of: 1. Profit margin. An increase in profit margin will increase the firm's ability to generate funds internally and thereby increase its sustainable growth. (Operating Efficiency) 2. Total asset turnover. An increase in the firm's total asset turnover increases the sales generated for each dollar in assets. This decreases the firm's need for new assets as sales grow and thereby increases the sustainable growth rate. (Asset Use Efficiency) 3. Equity Multiplier (Financial Leverage) a. Financial policy. An increase in the debt-equity ratio increases the firm's financial leverage. Because this makes additional debt financing available, it increases the sustainable growth rate. b. Dividend policy. A decrease in the percentage of net income paid out as dividends will increase the retention ratio. This increases internally generated equity and thus increases internal and sustainable growth. Internal Growth Rate = ROA X Retention Ratio 1-(ROA X Retention Ratio ROA = 1,746,690/ 20,399,148 = .086 IGR = ROEX Retention Ratio Sustainable Growth Rate =- 1-(ROE x Retention Ratio) ROE = 1,745,690/ 12,485,202 = 14% SGRE For the sustainable Growth Rate, the firm assumes a constant debt/equity ratio. SA SGR will grow because, as the firm grows earnings and retains them as equity, it must incur new debt to keep its debt/equity ratio the same. The new debt grows its revenue -generating assets. Internal Growth rate, assumes internal financing only, so debt will decline over time and assets are only increased by net income. Walmart Inc. Consolidated Statements of Income Fiscal Years Ended January 31, 2020 2021 2019 s 555,233 $ 3,918 559,151 519,926 $ 4,038 523.964 510,329 4,076 514,405 420,315 116,288 22.548 394,605 108,791 20,568 385,301 107,147 21,957 (Amounts in millions, except per share data) Revenues: Net sales Membership and other income Total revenues Costs and expenses: Cost of sales Operating, selling, general and administrative expenses Operating income Interest: Debt Finance, capital lease and financing obligations Interest income Interest, net Other (gains) and losses Income before income taxes Provision for income taxes Consolidated net income Consolidated net income attributable to noncontrolling interest Consolidated net income attributable to Walmart 1.976 339 (121) 2,194 (210) 20.564 6,858 13,706 (196) 13,510 2.262 337 (189) 2,410 (1,958) 20.116 4,915 15,201 (320) 14,881 1,975 371 (217) 2,129 8,368 11,460 4,281 7,179 (509) 6,670 S $ Net income per common share: Basic net income per common share attributable to Walmart Diluted net income per common share attributable to Walmart s $ 4.77 $ 4.75 5.22 5.19 2.28 2.26 Weighted average common shares outstanding: Basic Diluted 2,831 2.847 2,850 2,868 2,929 2.945 2.16 $ 2.12 $ 2.08 Dividends declared per common share See accompanying notes 54 Walmart Inc. Consolidated Balance Sheets As of January 31, 2021 2020 s (Amounts in millions) ASSETS Current assets: Cash and cash equivalents Receivables, net Inventories Prepaid expenses and other Total current assets 17,741 $ 6,516 44,949 20,861 90,067 9,465 6,284 44,435 1.622 61,806 Property and equipment, net Operating lease right-of-use assets Finance lease right-of-use assets, net Goodwill Other long-term assets Total assets 92,201 13,642 4,005 28.983 23,598 252,496 105,208 17,424 4,417 31,073 16,567 236,495 S LIABILITIES AND EQUITY Current liabilities: Short-term borrowings Accounts payable Accrued liabilities Accrued income taxes Long-term debt due within one year Operating lease obligations due within one year Finance lease obligations due within one year Total current liabilities 224 $ 49,141 37,966 242 3,115 1,466 491 92,645 575 46,973 22,296 280 5,362 1,793 511 77,790 Long-term debt Long-term operating lease obligations Long-term finance lease obligations Deferred income taxes and other 41,194 12,909 3,847 14,370 43,714 16,171 4.307 12,961 Commitments and contingencies Equity: Common stock Capital in excess of par value Retained earnings Accumulated other comprehensive loss Total Walmart shareholders' equity Noncontrolling interest Total equity Total liabilities and equity 282 3,646 88,763 (11,766) 80,925 6,606 87,531 252,496 284 3,247 83,943 (12,805) 74,669 6,883 81,552 236,495 $ Chapter 3: Working with Financial Statement A. Firm Liquidity Ratios (short term solvency): How liquid is the firm? Can it pay its approaching debt obligations? Current Assets Current Ratio Current Liabilities Walmart (in millions) Dollar General (in thousands) Industry Average Current Year Preceding Year Current Year (Discount Retail) 61,806 6,914,219 .97 0.79 = 1.21 77,790 5.710.783 1. Five Common Areas of Financial Ratio Analysis: A thorough financial ratio analysis will, at a minimum, include the following areas: A. Firm Liquidity (short term solvency) Financial leverage (increasing assets through debt) & solvency (Long term solvency) C. Firm Profitability D. Firm Asset Management E. Market value Measures B Current Assets-Inventory Quick Ratio = Current Liabilities .26 6,914,219-5,247,477 5,710,783 = 0.29 Cash Cash Ratio = Current Liabilities 1,376,577 = 0.24 5,710.783 Observations: B. Leverage Ratios (Long Term Solvency): How is the firm financing its assets? Total Liabilities (or Assets-Equity) Total Debt Ratio = Total Assets Walmart (in millions) Dollar General (in thousands) Current Year Preceding Year Current Year 154,943 19,201,386 = 0.66 = 0.74 236,495 25,862,624 Industry Average** (Discount Retail) + C. Firm Asset Management (Efficiency): Use of assets to generate cash. Sales Total Asset Turnover Ratio (TATO) = Total Assets Walmart (in millions) Dollar General (in thousands) Current Year Preceding Year Current Year 519,926 33,746,839 236,495 25,862,624 Industry Average (Discount Retail) 1.88 = 2.20 = 1.30 Total Liabilities Debt to Equity = Total Equity 0.6 19,201,386 = 2.88 6,661,238 Cost of goods sold Inventory Turnover (ITO)= Inventory 394,605 = 8.88 44,435 365 Days Sales in Inventory = ITO 23,027,977 = 4.39 5,247,477 7.26 Total Assets Equity Multiplier = OR 1+Debt to Equity Ratio Total Equity 25,862,624 6,661,238 365 = 41 days 8.88 365 = 83 days 4.39 50.28 days 3.88 Days Sales in Receivables Sales Accounts Receivable Turnover Ratio (ATO) = Accounts receivable N/A 365 ATO 119.2 Times Interest Earned EBIT (Operating Income) Interest Expense 6.33 3,554,765 = 23.64 150.385 3.06 days Payables Turnover (PTO)= Cost of goods sold Accounts Payable Days in Account Payable = 365 PTO 23,027,977 = 6.37 3,614,089 EBIT+(Depr+Amort) Cash Coverage Interest Expense + 11.152 20,568 + 10.987 * 2,410 *not on income statement, from --- = 13.09 Stmt of Cash Flows 10.79 3,554,765 + 574,237 150,385 = 27.46 *not on income statement, from = Stmt of Cash Flows 365 6.37 = 57 days Observations: Observations: D. Firm Profitability: Are the firm's managers generating adequate operating profits on the company's assets? Gross Profit Margin = Gross Profit (Sales-Cost of Sales) Sales Walmart (in millions) Dollar General (in thousands) Industry Average Current Year Preceding Year Current Year (Discount Retail) 555,233 - 420,315 519.926 - 394,605 10.718,862 .264 = 0.32 555,233 519,926 33.746.839 = 0.24 = 0.24 E. Market Value Measures Price per share Price to Earnings Ratio = Earnings per share Walmart Current Year Preceding Year Price $139.65 as of 1/21/22 Dollar General Current Year $210.18 as of 7/6/21 Industry Average (Discount Retail) 24.94 X 139.65 = 29.28 times 4.77 210.18 10.70 = 19.64 times Earnings per share Net Income # of outstanding shares Operating Profit Margin = EBIT (Operating Income) Sales 13,510 =$4.77 2,831 $10.70 As reported on income statement .0355 3,554,765 = 0.11 33,746,839 Net Income Net Profit Margin= Sales Price to sales ratio = Price per share Sales per share 555,233 =$196.13 2,831 .80 .0273 2,655,050 33.746.839 33,746,839 =$140.15 240,785 0.079 X 139.65 = 0.71 times 196.13 210.18 = 1.50 times 140.15 Net Income Return on Assets = Total Assets Market to book value ratio = Market value per share ok value per share 87,531 =$30.92 BVPS .0514 2,655,050 = 0.102 25,862,624 Equity BV= # of outstanding shares 6,661,238 =$27.66 BVPS 240,785 2,831 139.65 = 4.52 times 30.92 210.18 = 7.62 times 4.8 times book 27.66 Net Income Return on Equity = Equity .1650 2.655,050 = .399 6,661,238 Enterprise Value (EV) = Market Capitalization + Liabilities - Cash Market Cap = # Shares x Market Price EV Enterprise Value Ratio = EBITDA Mkt Cap = 2,831 * 139.65 = $395,349 (in millions) EV = 395,349 +164,965 17,741 = 542,573 542,573 Enterprise Value Ratio = = 16.10 33700 Observations: What drives operating profit margin? Operating profit = (Price x quantity sold) - COGS - operating expenses - # of units sold Revenue Ave. selling price/unit - Cost of making or producing the product or service Expenses Ability to control general and administrative expenses Observations: Ability to control cost of marketing Idistributing III. ROE-A Second Look: The DuPont Model: Brings ratio analysis together into a graphic representation Internal and sustainable Growth Due to some complexities in the equity structure of Walmart and Target, we will use some simplified numbers from the hypothetical financial statements of 5&Air, inc. for this section. See p.95 of the textbook. The internal and sustainable growth formulas tell a firm how much it should expect to grow revenue under two different assumptions. S&S Air, Inc. 585 Addition to Net Income Dividends Retained Total Assets Equity Earnings 51,746,690 $ 270,600 $1,476,090 $20,399,148 $12,485,202 Traditional ROE net income total common equity In terms of assets (multiply above by assets/assets), ROE = ROA X Equity Multiplier If we then look at it in terms of sales (multiply by sales/sales) Therefore, ROE = PM X TATO X Equity Multiplier DuPont ROE net income sales sales total assets total assets total equity Dividend Payout Ratio = Cash Dividend/Net Income Retention Ratio - Addition to retained earnings/Net Income (Plowback ratio) The DuPont madel enables us to break down ROE in to components. We can then identify the drivers of ROE, and thus (theoretically improve the measure. ROE is a function of: 1. Profit margin. An increase in profit margin will increase the firm's ability to generate funds internally and thereby increase its sustainable growth. (Operating Efficiency) 2. Total asset turnover. An increase in the firm's total asset turnover increases the sales generated for each dollar in assets. This decreases the firm's need for new assets as sales grow and thereby increases the sustainable growth rate. (Asset Use Efficiency) 3. Equity Multiplier (Financial Leverage) a. Financial policy. An increase in the debt-equity ratio increases the firm's financial leverage. Because this makes additional debt financing available, it increases the sustainable growth rate. b. Dividend policy. A decrease in the percentage of net income paid out as dividends will increase the retention ratio. This increases internally generated equity and thus increases internal and sustainable growth. Internal Growth Rate = ROA X Retention Ratio 1-(ROA X Retention Ratio ROA = 1,746,690/ 20,399,148 = .086 IGR = ROEX Retention Ratio Sustainable Growth Rate =- 1-(ROE x Retention Ratio) ROE = 1,745,690/ 12,485,202 = 14% SGRE For the sustainable Growth Rate, the firm assumes a constant debt/equity ratio. SA SGR will grow because, as the firm grows earnings and retains them as equity, it must incur new debt to keep its debt/equity ratio the same. The new debt grows its revenue -generating assets. Internal Growth rate, assumes internal financing only, so debt will decline over time and assets are only increased by net income. Walmart Inc. Consolidated Statements of Income Fiscal Years Ended January 31, 2020 2021 2019 s 555,233 $ 3,918 559,151 519,926 $ 4,038 523.964 510,329 4,076 514,405 420,315 116,288 22.548 394,605 108,791 20,568 385,301 107,147 21,957 (Amounts in millions, except per share data) Revenues: Net sales Membership and other income Total revenues Costs and expenses: Cost of sales Operating, selling, general and administrative expenses Operating income Interest: Debt Finance, capital lease and financing obligations Interest income Interest, net Other (gains) and losses Income before income taxes Provision for income taxes Consolidated net income Consolidated net income attributable to noncontrolling interest Consolidated net income attributable to Walmart 1.976 339 (121) 2,194 (210) 20.564 6,858 13,706 (196) 13,510 2.262 337 (189) 2,410 (1,958) 20.116 4,915 15,201 (320) 14,881 1,975 371 (217) 2,129 8,368 11,460 4,281 7,179 (509) 6,670 S $ Net income per common share: Basic net income per common share attributable to Walmart Diluted net income per common share attributable to Walmart s $ 4.77 $ 4.75 5.22 5.19 2.28 2.26 Weighted average common shares outstanding: Basic Diluted 2,831 2.847 2,850 2,868 2,929 2.945 2.16 $ 2.12 $ 2.08 Dividends declared per common share See accompanying notes 54 Walmart Inc. Consolidated Balance Sheets As of January 31, 2021 2020 s (Amounts in millions) ASSETS Current assets: Cash and cash equivalents Receivables, net Inventories Prepaid expenses and other Total current assets 17,741 $ 6,516 44,949 20,861 90,067 9,465 6,284 44,435 1.622 61,806 Property and equipment, net Operating lease right-of-use assets Finance lease right-of-use assets, net Goodwill Other long-term assets Total assets 92,201 13,642 4,005 28.983 23,598 252,496 105,208 17,424 4,417 31,073 16,567 236,495 S LIABILITIES AND EQUITY Current liabilities: Short-term borrowings Accounts payable Accrued liabilities Accrued income taxes Long-term debt due within one year Operating lease obligations due within one year Finance lease obligations due within one year Total current liabilities 224 $ 49,141 37,966 242 3,115 1,466 491 92,645 575 46,973 22,296 280 5,362 1,793 511 77,790 Long-term debt Long-term operating lease obligations Long-term finance lease obligations Deferred income taxes and other 41,194 12,909 3,847 14,370 43,714 16,171 4.307 12,961 Commitments and contingencies Equity: Common stock Capital in excess of par value Retained earnings Accumulated other comprehensive loss Total Walmart shareholders' equity Noncontrolling interest Total equity Total liabilities and equity 282 3,646 88,763 (11,766) 80,925 6,606 87,531 252,496 284 3,247 83,943 (12,805) 74,669 6,883 81,552 236,495 $


