Answered step by step
Verified Expert Solution
Question
1 Approved Answer
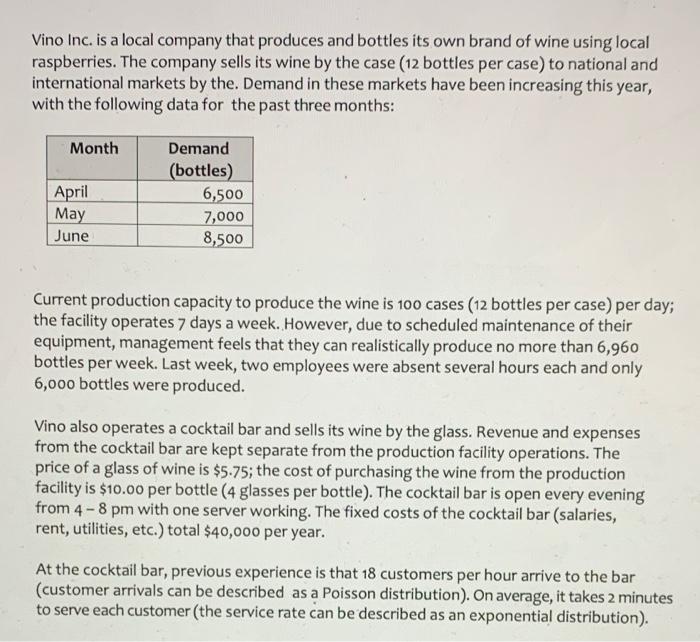
Vino Inc. is a local company that produces and bottles its own brand of wine using local raspberries. The company sells its wine by


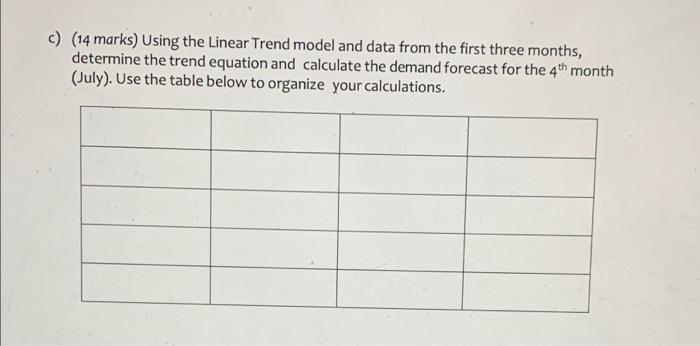
Vino Inc. is a local company that produces and bottles its own brand of wine using local raspberries. The company sells its wine by the case (12 bottles per case) to national and international markets by the. Demand in these markets have been increasing this year, with the following data for the past three months: Month April May June Demand (bottles) 6,500 7,000 8,500 Current production capacity to produce the wine is 100 cases (12 bottles per case) per day; the facility operates 7 days a week. However, due to scheduled maintenance of their equipment, management feels that they can realistically produce no more than 6,960 bottles per week. Last week, two employees were absent several hours each and only 6,000 bottles were produced. Vino also operates a cocktail bar and sells its wine by the glass. Revenue and expenses from the cocktail bar are kept separate from the production facility operations. The price of a glass of wine is $5.75; the cost of purchasing the wine from the production facility is $10.00 per bottle (4 glasses per bottle). The cocktail bar is open every evening from 4-8 pm with one server working. The fixed costs of the cocktail bar (salaries, rent, utilities, etc.) total $40,000 per year. At the cocktail bar, previous experience is that 18 customers per hour arrive to the bar (customer arrivals can be described as a Poisson distribution). On average, it takes 2 minutes to serve each customer (the service rate can be described as an exponential distribution). a) (16 marks) Using the Trend Adjusted Exponential Smoothing model, calculate the demand forecast for the 4th month (July); let a = 0.5 and = 0.8 (start with initial estimates for April of S = 6,000 and T = 400). b) (8 marks) Using the 3-Month Moving Average method, calculate what the demand forecast would be for April, May and June and for the 4th month (July). For this method, the actual demand for January, February and March was 4,400, 5,000 and 5,800 bottles respectively. c) (14 marks) Using the Linear Trend model and data from the first three months, determine the trend equation and calculate the demand forecast for the 4th month (July). Use the table below to organize your calculations. (10 marks) Calculate MSE (for April - June) for each of the methods above. What is the preferred method and why? State any necessary assumptions.
Step by Step Solution
★★★★★
3.52 Rating (152 Votes )
There are 3 Steps involved in it
Step: 1
1 We will initially find the forecast according to the outstanding smoothing recipe utilizing alpha worth and afterwards trend utilizing beta worth Th...
Get Instant Access to Expert-Tailored Solutions
See step-by-step solutions with expert insights and AI powered tools for academic success
Step: 2

Step: 3

Ace Your Homework with AI
Get the answers you need in no time with our AI-driven, step-by-step assistance
Get Started


