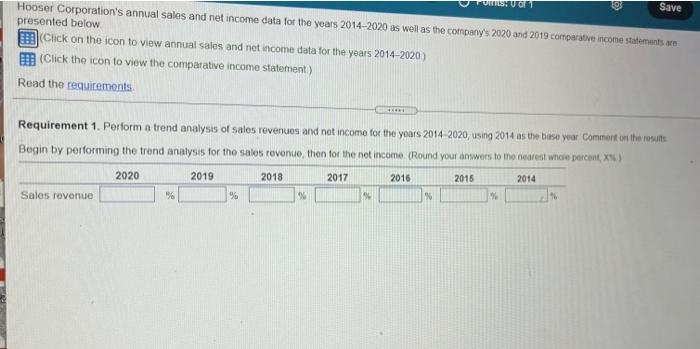
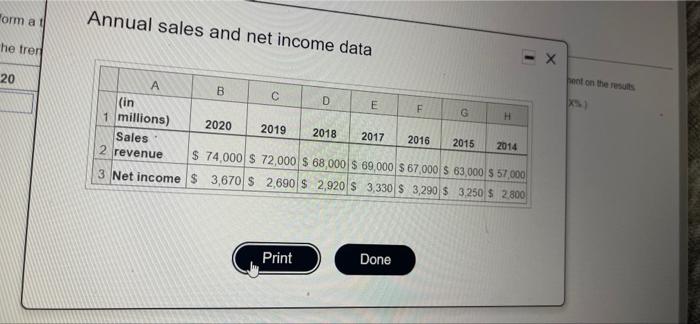
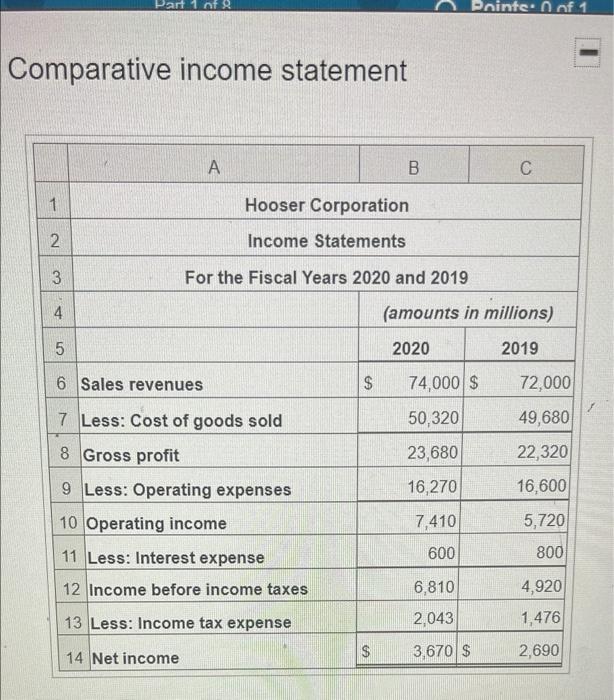
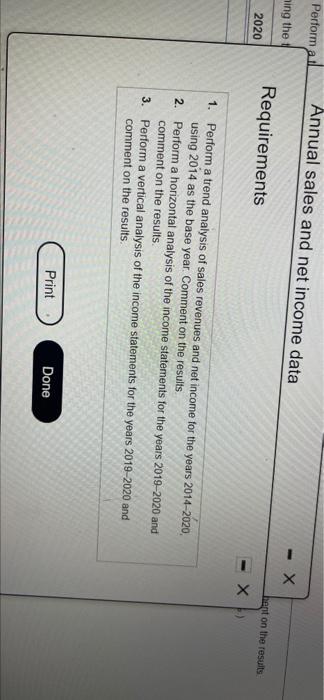
VRSY VORT Save Hooser Corporation's annual sales and net income data for the years 2014-2020 as well as the company's 2020 and 2019 comparative come statements presented below Click on the icon to view annual sales and net income data for the years 2014-2020) Click the icon to view the comparative income statement) Read the requirements Requirement 1. Perform a trend analysis of sales revenues and net income for the years 2014-2020, using 2014 as the base your Comment on the results Begin by performing the trend analysis for the sales revenue, thon for the net income (Round your answers to the nearest whole percent X) 2020 2019 2018 2017 2016 2016 2014 Sales revenue % 9 % Form a Annual sales and net income data he treri - 20 bent on the results B D E F G H (in 1 millions) 2020 2019 2018 2017 2016 2015 2014 Sales 2 revenue $ 74,000 $ 72,000 $ 68,000 $ 69,000 S 67 000 $ 63,000 S 57.000 3 Net income $ 3,670 $ 2,690 $ 2,920 $ 3,330 $ 3,290 $ 3,250 $ 2.800 Print Done Part 1 of Pointe. n of 1 Comparative income statement A B 1 Hooser Corporation 2 Income Statements N 3 For the Fiscal Years 2020 and 2019 4 (amounts in millions) 5 2020 2019 6 Sales revenues $ 74,000 $ 72,000 7 Less: Cost of goods sold 50,320 49,680 8 Gross profit 23,680 22,320 16,270 16,600 9 Less: Operating expenses 10 Operating income 7,410 5,720 11 Less: Interest expense 600 800 12 Income before income taxes 4,920 6,810 2,043 13 Less: Income tax expense 1,476 14 Net income $ 3,670 $ 2,690 Perform a il Annual sales and net income data ning the - X Requirements hent on the results 2020 EX 1. Perform a trend analysis of sales revenues and net income for the years 2014-2020, using 2014 as the base year. Comment on the results 2. Perform a horizontal analysis of the income statements for the years 2019-2020 and comment on the results 3. Perform a vertical analysis of the income statements for the years 2019-2020 and comment on the results Print Done