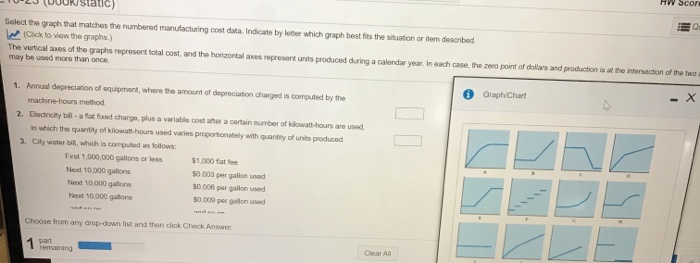
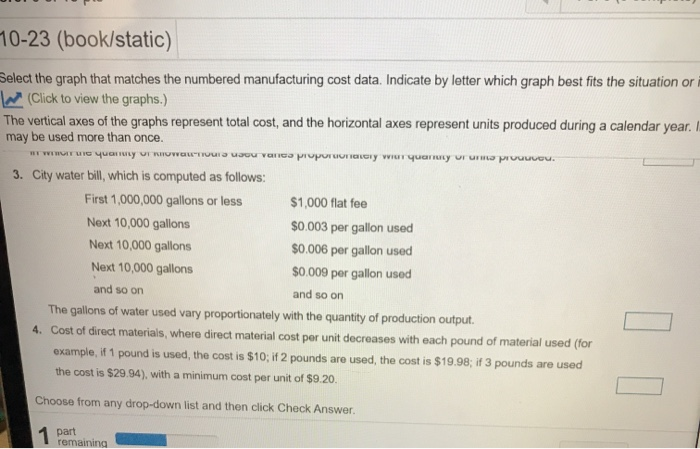
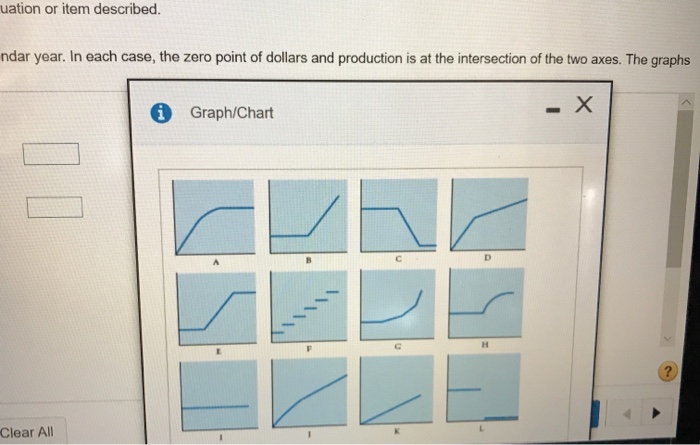
- VUUN static) Select the graph that matches the numbered manufacturing out data indicate by loter which graph best fits the station or item described Click to view the graphs.) The verticale of the graphs represent total cost and the horizontales present its produced during a calendar year in each case, the zero point of dollars and production is may be more than once the intersection of the two 0 Graph Chart 1. Annual depreciation of equipment, where the amount of depreciation charged is computed by the machine-hours method 2. Doch auf charge plus avarie costa a certain sumber of lowatt-hours are used in which the quantity of kilowatt. hours used varies proportionately with quantity of its produced 3. Chy water , which is computed as follows: F t 1,000,000 gallons or less $1.000 fate 10.000 gans 50.003 per gallion used Ne 10.000 gallons 50.006 per gallon used 10 000 50 000 per one Choose from any drop down and then click Check Ansa 1 port Clear ning 10-23 (book/static) Select the graph that matches the numbered manufacturing cost data. Indicate by letter which graph best fits the situation or i (Click to view the graphs.) The vertical axes of the graphs represent total cost, and the horizontal axes represent units produced during a calendar year. I may be used more than once. WHITUS YULE UI RIIULUISUD Vapoporuly wr query UF UW PUUUUU. 3. City water bill, which is computed as follows: First 1,000,000 gallons or less $1,000 flat fee Next 10,000 gallons $0.003 per gallon used Next 10,000 gallons $0.006 per gallon used Next 10,000 gallons $0.009 per gallon used and so on and so on The gallons of water used vary proportionately with the quantity of production output. 4. Cost of direct materials, where direct material cost per unit decreases with each pound of material used (for example, if 1 pound is used, the cost is $10; if 2 pounds are used, the cost is $19.98; if 3 pounds are used the cost is $29.94), with a minimum cost per unit of $9.20. Choose from any drop-down list and then click Check Answer 1 part remaining uation or item described. indar year. In each case, the zero point of dollars and production is at the intersection of the two axes. The graphs Graph/Chart Clear All