

Answered step by step
Verified Expert Solution
Question
1 Approved Answer
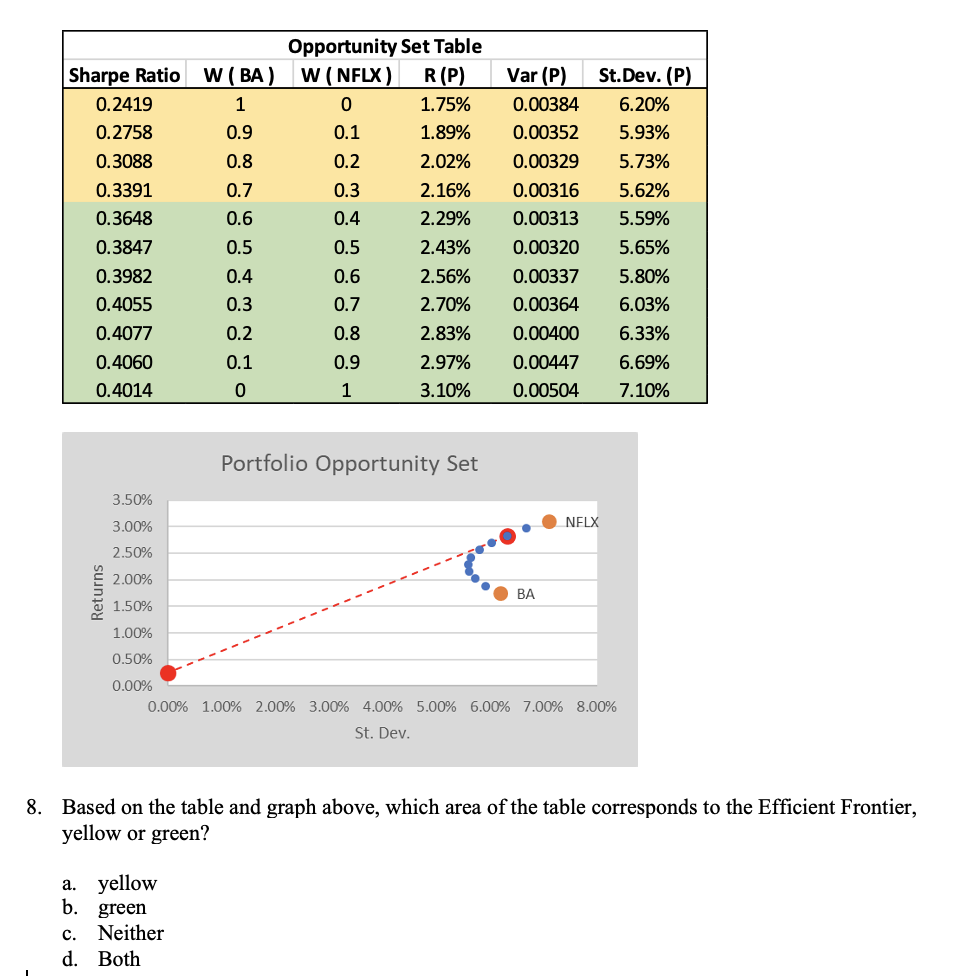
W (BA) 1 0.9 0.8 0.7 0.6 Sharpe Ratio 0.2419 0.2758 0.3088 0.3391 0.3648 0.3847 0.3982 0.4055 0.4077 0.4060 0.4014 Opportunity Set Table W (NFLX)
Step by Step Solution
There are 3 Steps involved in it
Step: 1

Get Instant Access to Expert-Tailored Solutions
See step-by-step solutions with expert insights and AI powered tools for academic success
Step: 2

Step: 3
Ace Your Homework with AI
Get the answers you need in no time with our AI-driven, step-by-step assistance
Get Started
Crypto Asset Investing In The Age Of Autonomy
Authors: Jake Ryan
1st Edition
1119705363, 978-1119705369