

Answered step by step
Verified Expert Solution
Question
1 Approved Answer
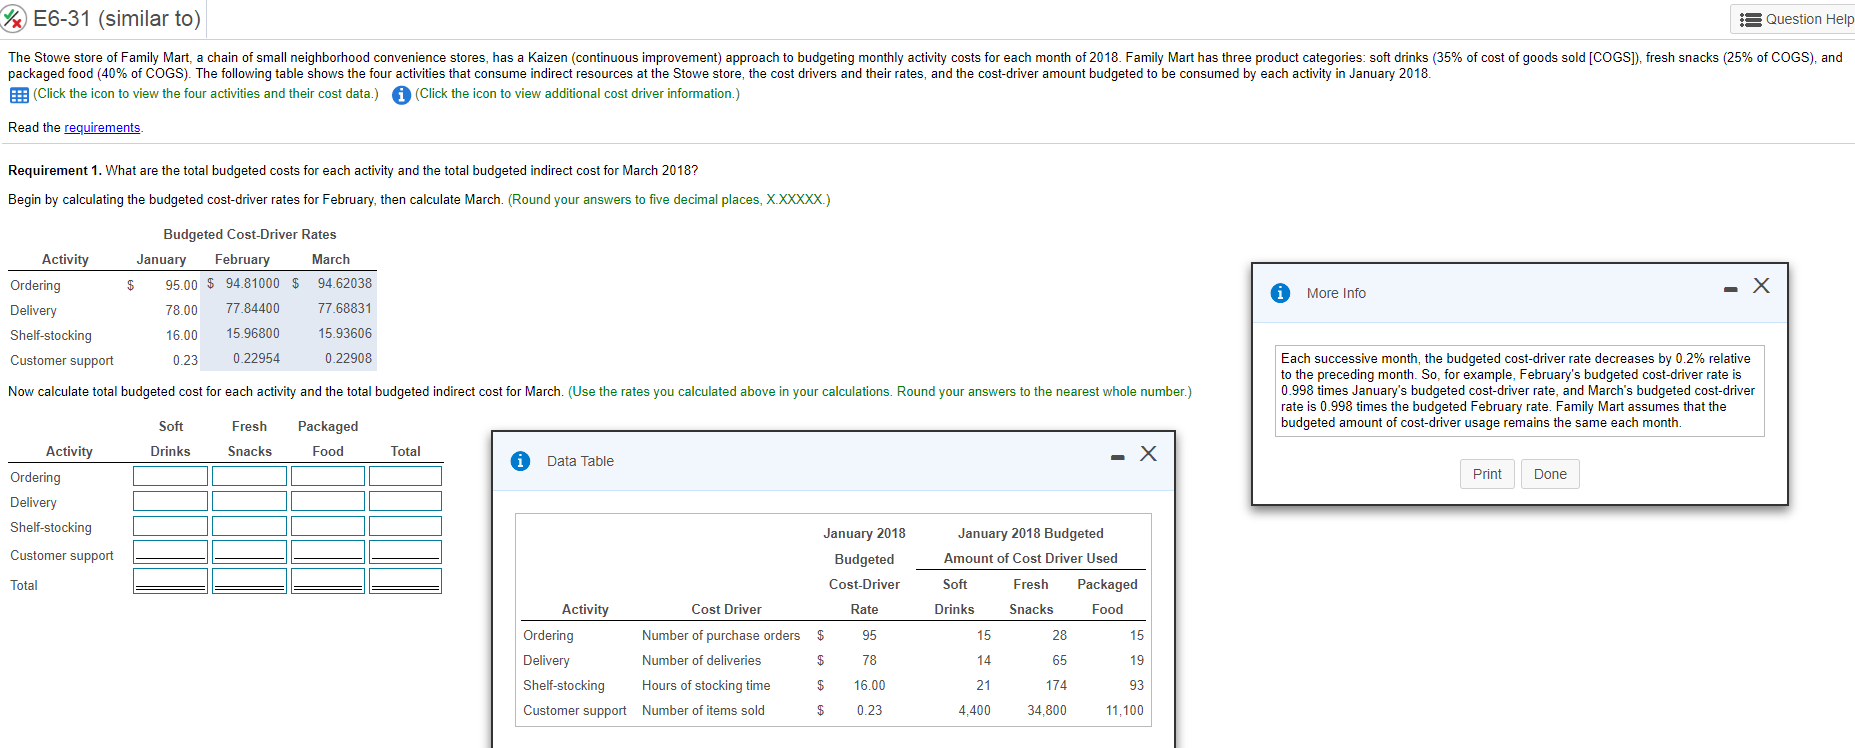
W E6-31 (similar to) Question Help The Stowe store of Family Mart, a chain of small neighborhood convenience stores, has a Kaizen (continuous improvement) approach
Step by Step Solution
There are 3 Steps involved in it
Step: 1

Get Instant Access to Expert-Tailored Solutions
See step-by-step solutions with expert insights and AI powered tools for academic success
Step: 2

Step: 3
Ace Your Homework with AI
Get the answers you need in no time with our AI-driven, step-by-step assistance
Get Started
Auditing Humor And Other Oxymorons
Authors: Mr Mike Jacka
1st Edition
0991280903, 978-0991280902