Answered step by step
Verified Expert Solution
Question
1 Approved Answer
W (K$) 14 13 Rich 12 11 10 9 8 7 6 5 Poor W (K$) 14 13 12 11 10 9 8 7

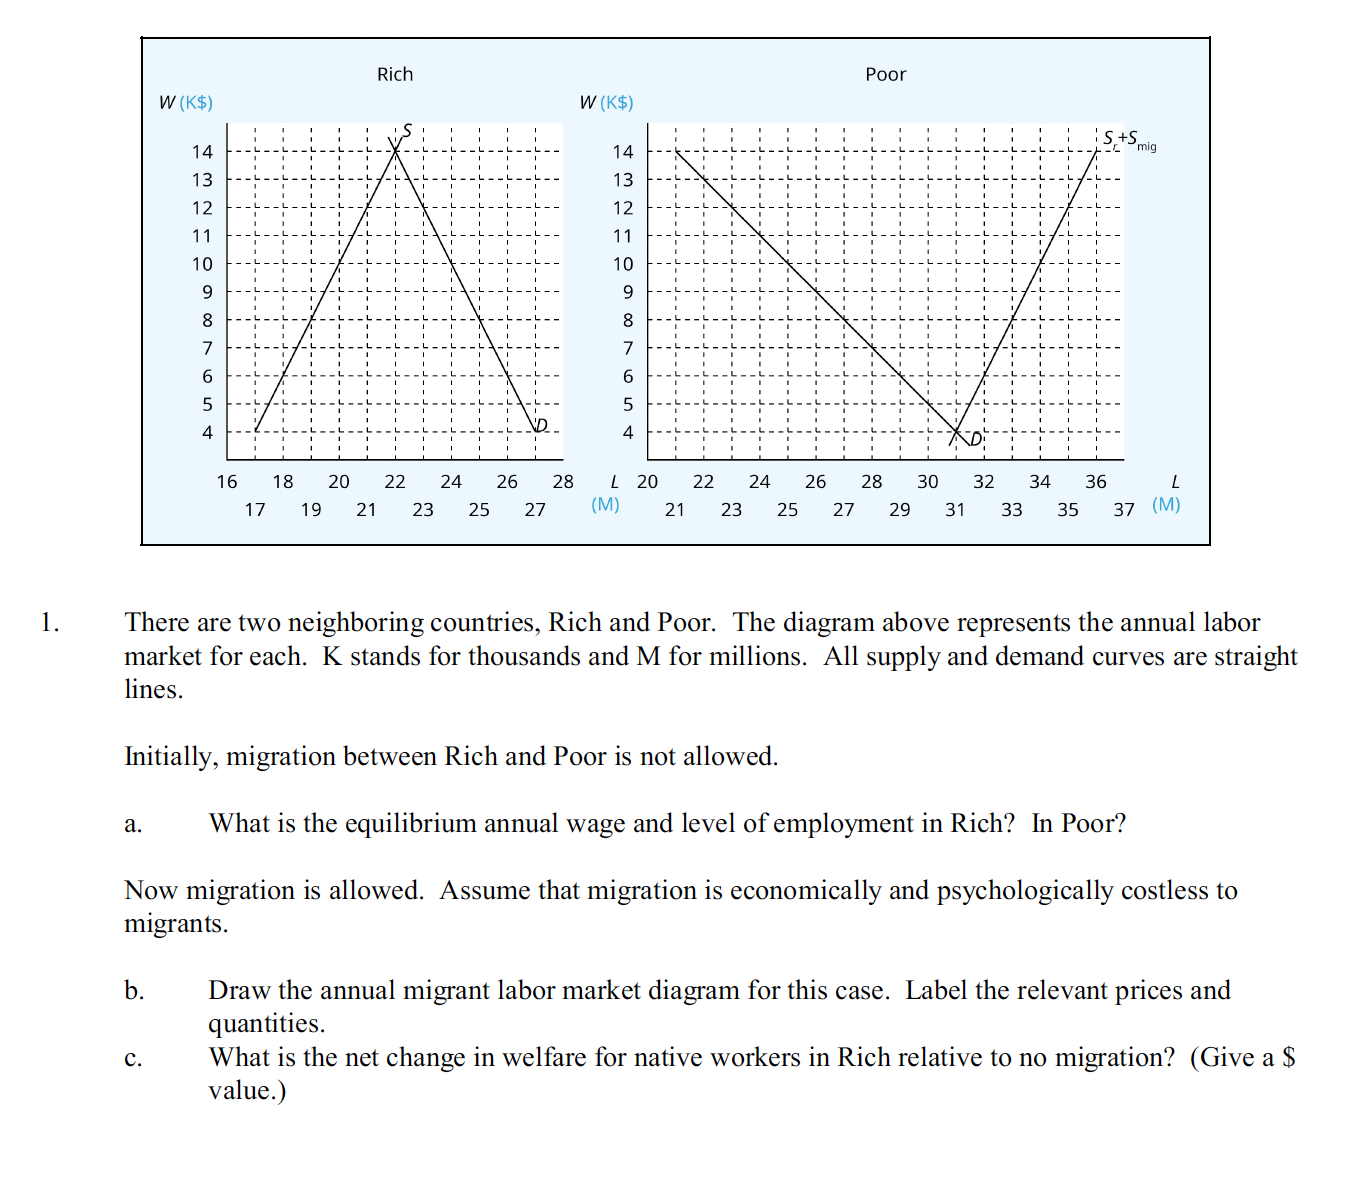
W (K$) 14 13 Rich 12 11 10 9 8 7 6 5 Poor W (K$) 14 13 12 11 10 9 8 7 6 5 4 16 18 20 22 24 26 28 17 19 21 L 20 22 24 26 23 25 27 (M) 21 23 25 27 29 31 28 30 32 34 36 L 33 35 37 (M) 1. There are two neighboring countries, Rich and Poor. The diagram above represents the annual labor market for each. K stands for thousands and M for millions. All supply and demand curves are straight lines. Initially, migration between Rich and Poor is not allowed. a. What is the equilibrium annual wage and level of employment in Rich? In Poor? Now migration is allowed. Assume that migration is economically and psychologically costless to migrants. b. C. Draw the annual migrant labor market diagram for this case. Label the relevant prices and quantities. What is the net change in welfare for native workers in Rich relative to no migration? (Give a $ value.)
Step by Step Solution
There are 3 Steps involved in it
Step: 1
a Without migration the equilibrium annual wage and level of employment in Rich and Poor can be dete...
Get Instant Access to Expert-Tailored Solutions
See step-by-step solutions with expert insights and AI powered tools for academic success
Step: 2

Step: 3

Ace Your Homework with AI
Get the answers you need in no time with our AI-driven, step-by-step assistance
Get Started


