

Answered step by step
Verified Expert Solution
Question
1 Approved Answer
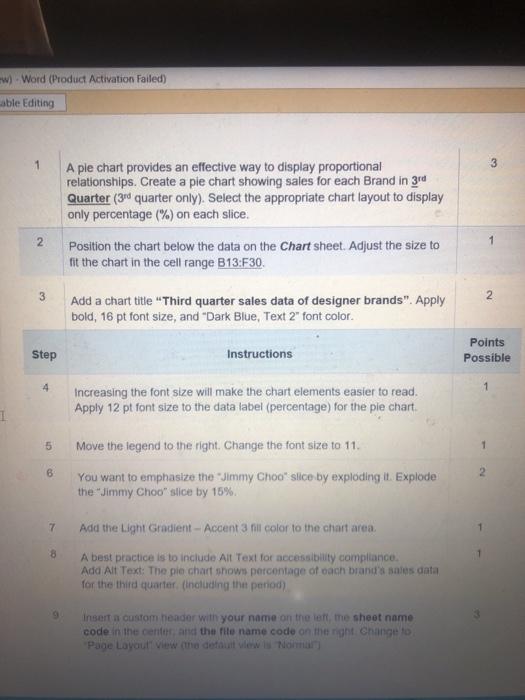
w) - Word (Product Activation Failed) able Editing 3 A ple chart provides an effective way to display proportional relationships. Create a pie chart showing
Step by Step Solution
There are 3 Steps involved in it
Step: 1

Get Instant Access to Expert-Tailored Solutions
See step-by-step solutions with expert insights and AI powered tools for academic success
Step: 2

Step: 3
Ace Your Homework with AI
Get the answers you need in no time with our AI-driven, step-by-step assistance
Get Started
Essentials of Database Management
Authors: Jeffrey A. Hoffer, Heikki Topi, Ramesh Venkataraman
1st edition
133405680, 9780133547702 , 978-0133405682