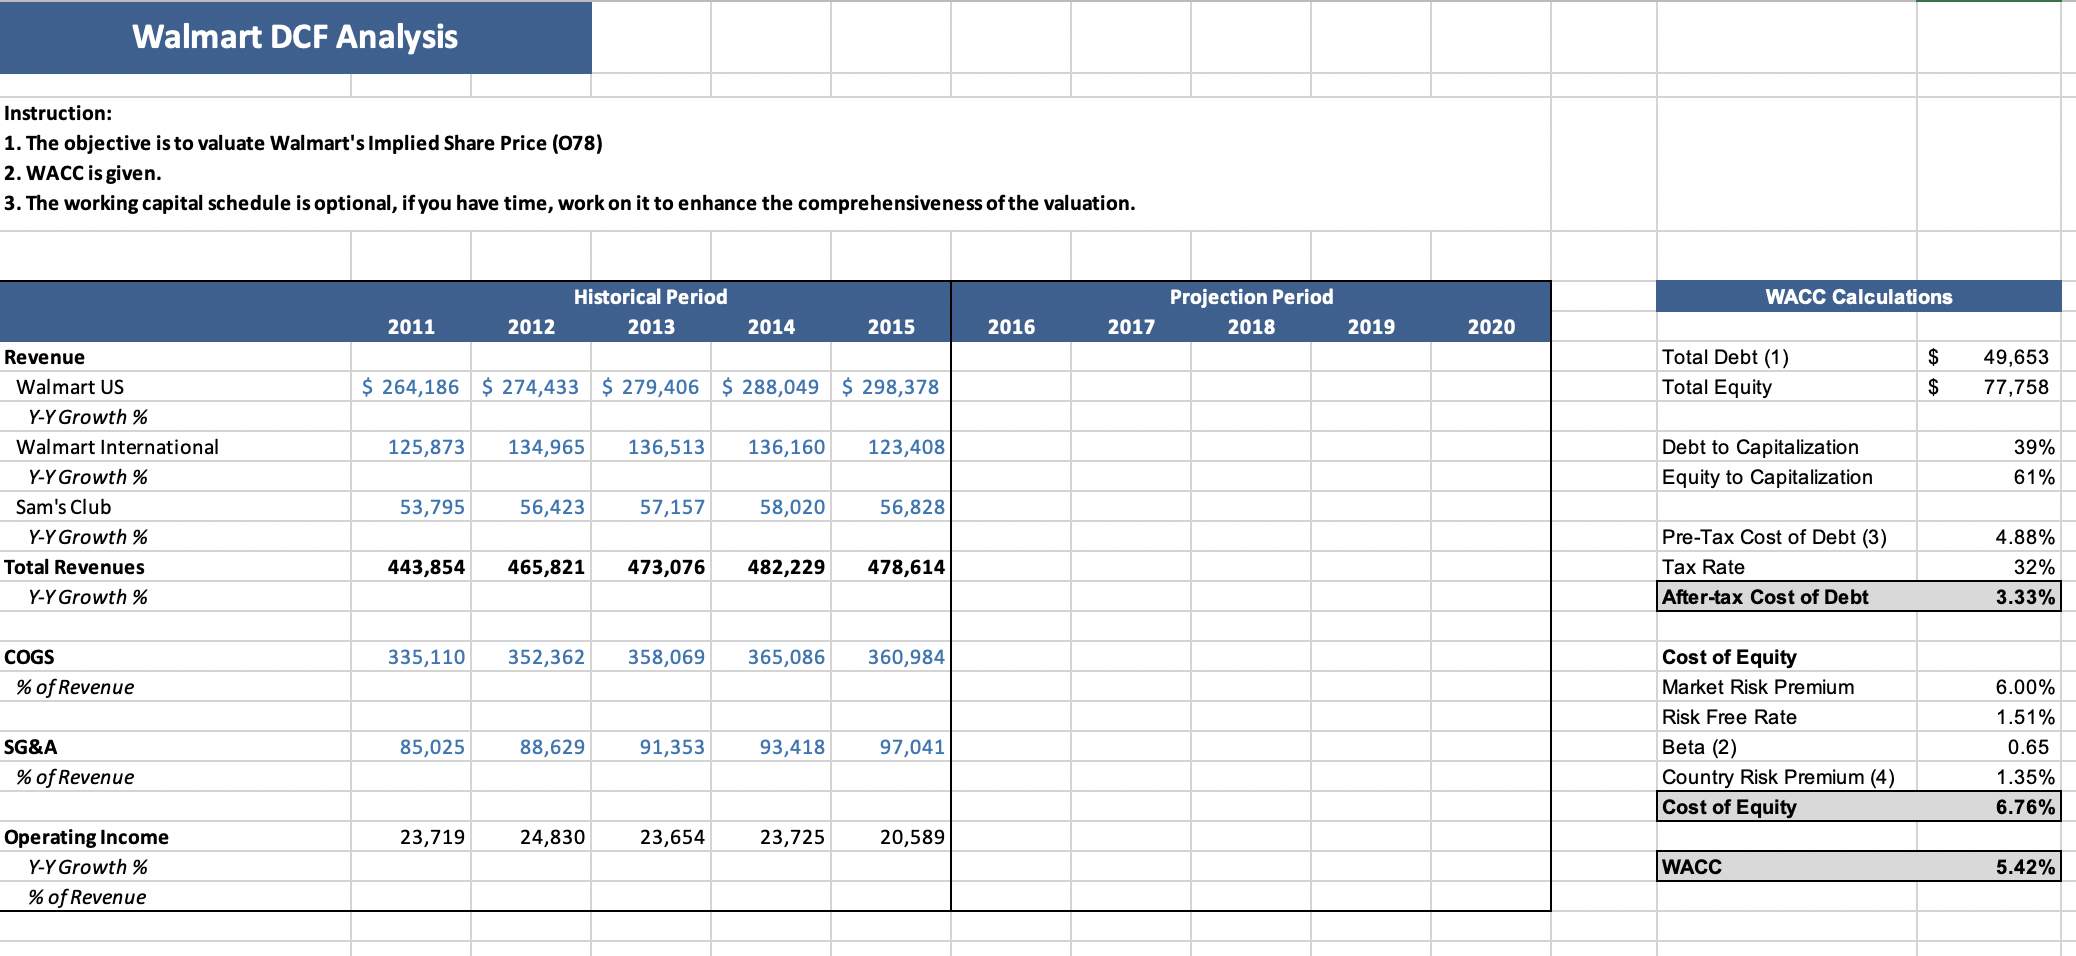
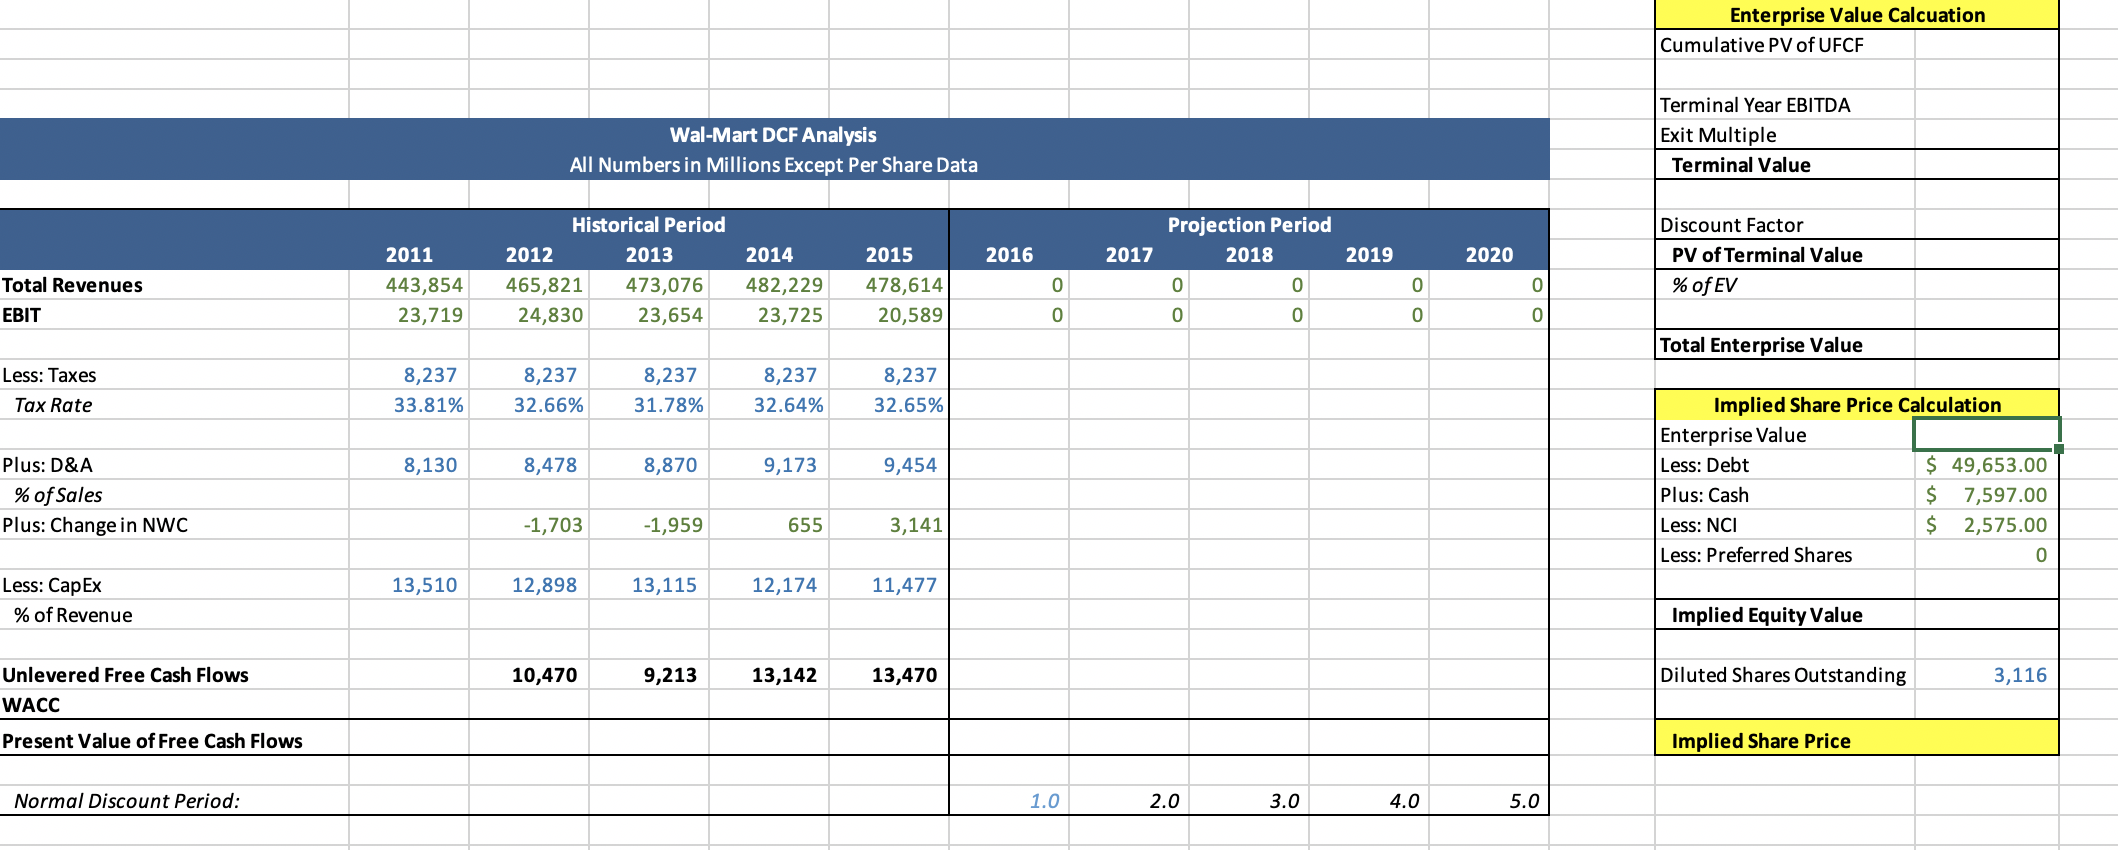
Walmart DCF Analysis Instruction: 1. The objective is to valuate Walmart's Implied Share Price (078) 2. WACC is given. 3. The working capital schedule is optional, if you have time, work on it to enhance the comprehensiveness of the valuation. WACC Calculations Historical Period 2013 Projection Period 2018 2011 2012 2014 2015 2016 2017 2019 2020 Total Debt (1) Total Equity 49,653 77,758 $ 264,186 $ 274,433 $ 279,406 $ 288,049 $ 298,378 125,873 134,965 136,513 136,160 123,408 Revenue Walmart US Y-Y Growth % Walmart International Y-Y Growth % Sam's Club Y-Y Growth % Total Revenues Y-Y Growth % Debt to Capitalization Equity to Capitalization 39% 61% 53,795 56,423 57,157 58,020 56,828 443,854 465,821 473,076482,229 478,614 Pre-Tax Cost of Debt (3) Tax Rate After-tax Cost of Debt 4.88% 32% 3.33% 335,110 352,362 358,069 365,086 360,984 COGS % of Revenue Cost of Equity Market Risk Premium Risk Free Rate Beta (2) Country Risk Premium (4) Cost of Equity 85,025 88,629 91,353 93,418 97,041 SG&A % of Revenue 6.00% 1.51% 0.65 1.35% 6.76% 23,719 24,830 23,654 23,725 20,589 Operating Income Y-Y Growth % % of Revenue WACC 5.42% Enterprise Value Calcuation Cumulative PV of UFCF Wal-Mart DCF Analysis All Numbers in Millions Except Per Share Data Terminal Year EBITDA Exit Multiple Terminal Value 2016 2017 2019 2020 2011 443,854 23,719 Historical Period 2012 2013 465,821 473,076 24,830 23,654 2014 482,229 23,725 Total Revenues EBIT Projection Period 2018 0 0 0 0 2015 478,614 20,589 Discount Factor PV of Terminal Value % of EV 0 Total Enterprise Value Less: Taxes Tax Rate 8,237 33.81% 8,237 32.66% 8,237 31.78% 8,237 32.64% 8,237 32.65% 8,130 8,478 8,870 9,173 9,454 Plus: D&A % of Sales Plus: Change in NWC Implied Share Price Calculation Enterprise Value Less: Debt $ 49,653.00 Plus: Cash $ 7,597.00 Less: NCI $ 2,575.00 Less: Preferred Shares -1,703 -1,959 655 3,141 13,510 12,898 13,115 12,174 11,477 Less: Cap Ex % of Revenue Implied Equity Value 10,470 9,213 13,142 13,470 Diluted Shares Outstanding 3,116 Unlevered Free Cash Flows WACC Present Value of Free Cash Flows Implied Share Price Normal Discount Period: - 1.0 2.0 3.0 4.0 5.0 Walmart DCF Analysis Instruction: 1. The objective is to valuate Walmart's Implied Share Price (078) 2. WACC is given. 3. The working capital schedule is optional, if you have time, work on it to enhance the comprehensiveness of the valuation. WACC Calculations Historical Period 2013 Projection Period 2018 2011 2012 2014 2015 2016 2017 2019 2020 Total Debt (1) Total Equity 49,653 77,758 $ 264,186 $ 274,433 $ 279,406 $ 288,049 $ 298,378 125,873 134,965 136,513 136,160 123,408 Revenue Walmart US Y-Y Growth % Walmart International Y-Y Growth % Sam's Club Y-Y Growth % Total Revenues Y-Y Growth % Debt to Capitalization Equity to Capitalization 39% 61% 53,795 56,423 57,157 58,020 56,828 443,854 465,821 473,076482,229 478,614 Pre-Tax Cost of Debt (3) Tax Rate After-tax Cost of Debt 4.88% 32% 3.33% 335,110 352,362 358,069 365,086 360,984 COGS % of Revenue Cost of Equity Market Risk Premium Risk Free Rate Beta (2) Country Risk Premium (4) Cost of Equity 85,025 88,629 91,353 93,418 97,041 SG&A % of Revenue 6.00% 1.51% 0.65 1.35% 6.76% 23,719 24,830 23,654 23,725 20,589 Operating Income Y-Y Growth % % of Revenue WACC 5.42% Enterprise Value Calcuation Cumulative PV of UFCF Wal-Mart DCF Analysis All Numbers in Millions Except Per Share Data Terminal Year EBITDA Exit Multiple Terminal Value 2016 2017 2019 2020 2011 443,854 23,719 Historical Period 2012 2013 465,821 473,076 24,830 23,654 2014 482,229 23,725 Total Revenues EBIT Projection Period 2018 0 0 0 0 2015 478,614 20,589 Discount Factor PV of Terminal Value % of EV 0 Total Enterprise Value Less: Taxes Tax Rate 8,237 33.81% 8,237 32.66% 8,237 31.78% 8,237 32.64% 8,237 32.65% 8,130 8,478 8,870 9,173 9,454 Plus: D&A % of Sales Plus: Change in NWC Implied Share Price Calculation Enterprise Value Less: Debt $ 49,653.00 Plus: Cash $ 7,597.00 Less: NCI $ 2,575.00 Less: Preferred Shares -1,703 -1,959 655 3,141 13,510 12,898 13,115 12,174 11,477 Less: Cap Ex % of Revenue Implied Equity Value 10,470 9,213 13,142 13,470 Diluted Shares Outstanding 3,116 Unlevered Free Cash Flows WACC Present Value of Free Cash Flows Implied Share Price Normal Discount Period: - 1.0 2.0 3.0 4.0 5.0