WALT DISNEY COMPANY Financial Analysis Fiscal 2017-2022 Numbers in Thousands, except where indicated*
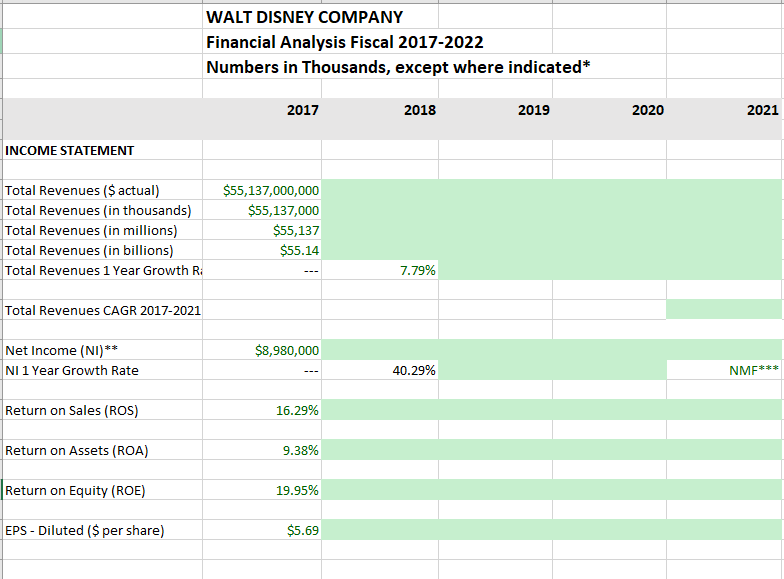
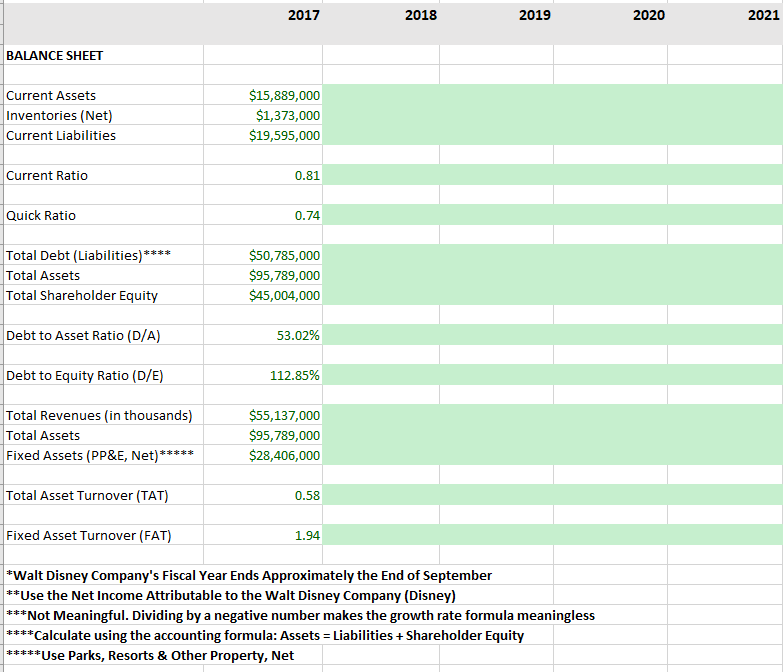
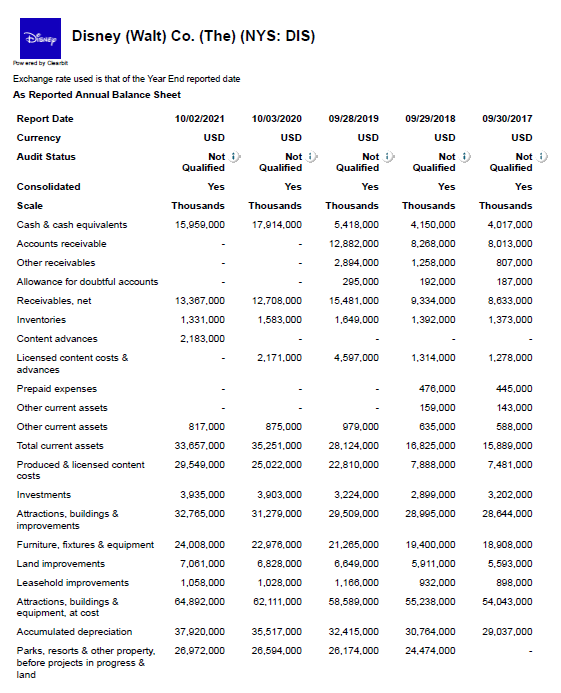
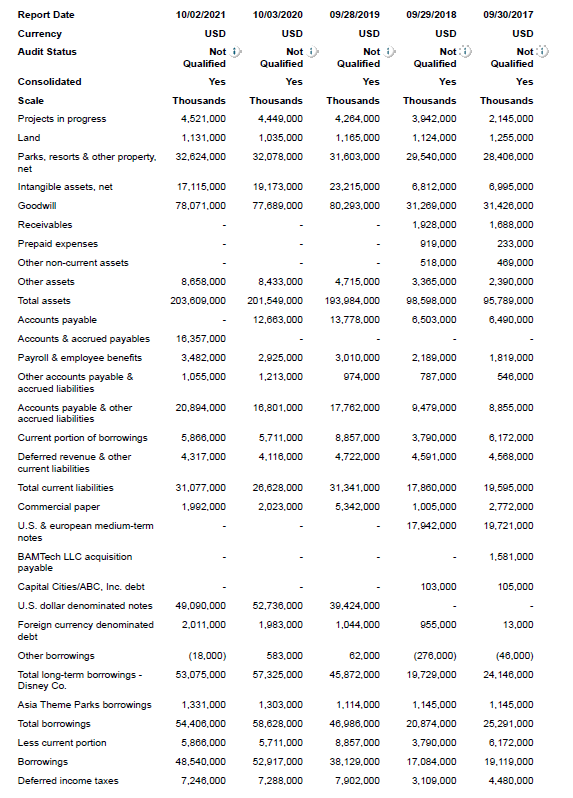
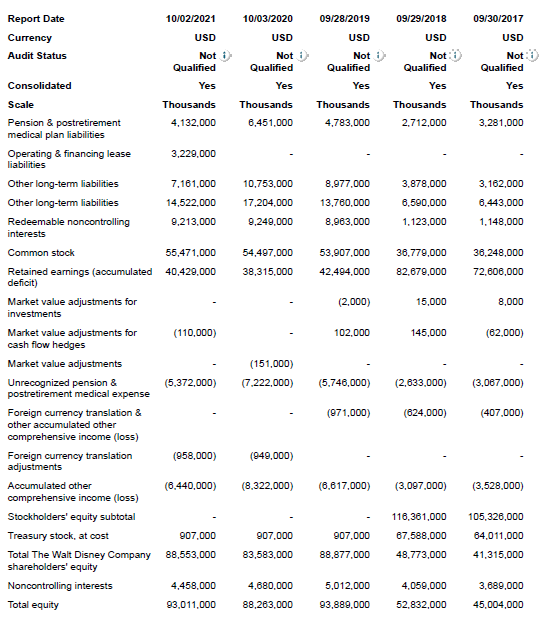
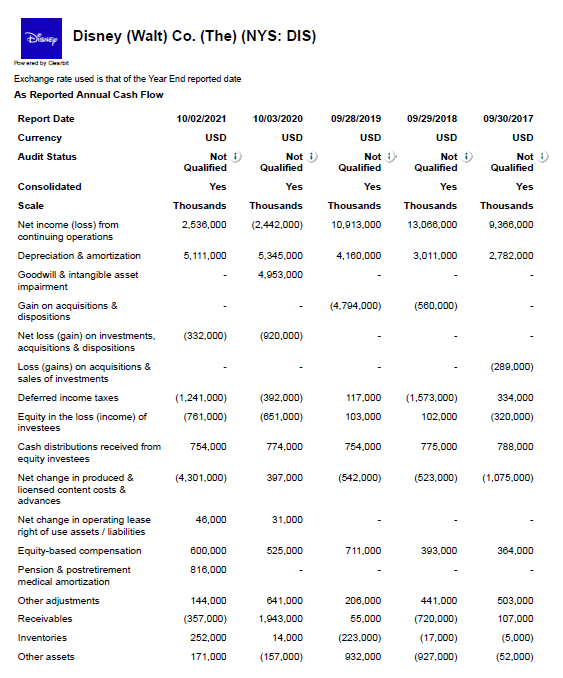
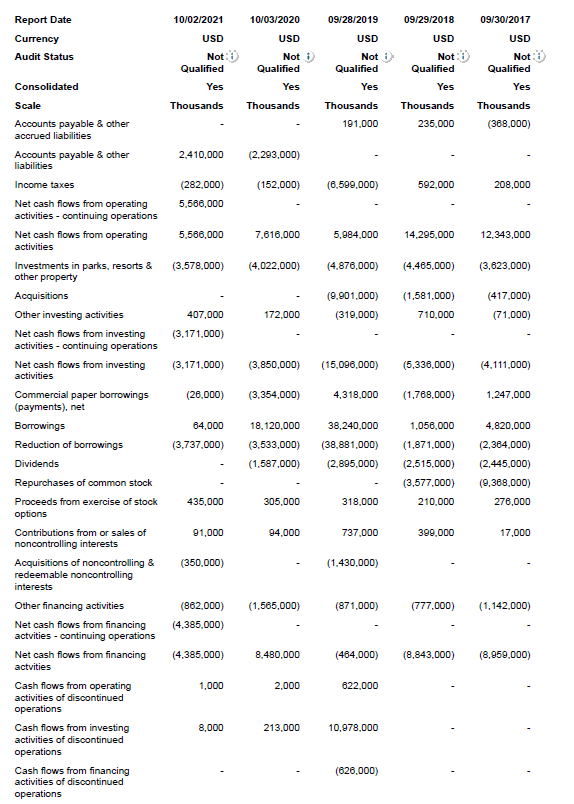
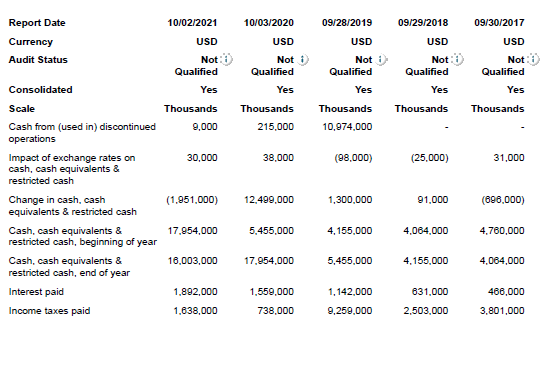
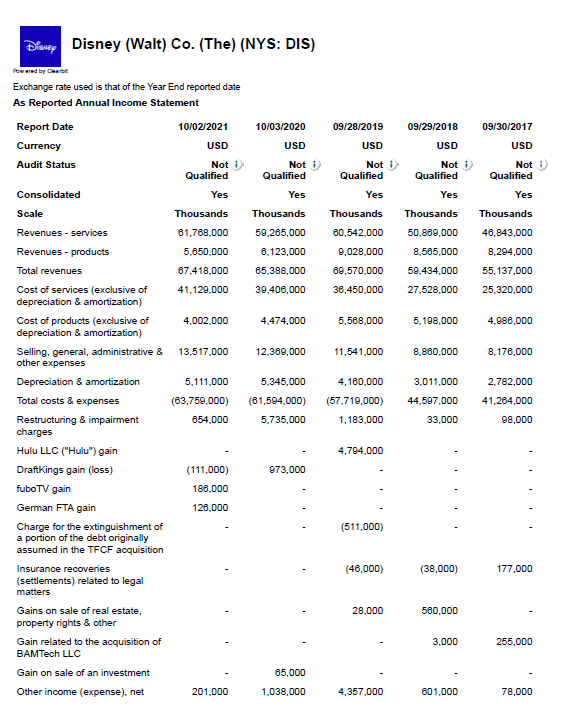
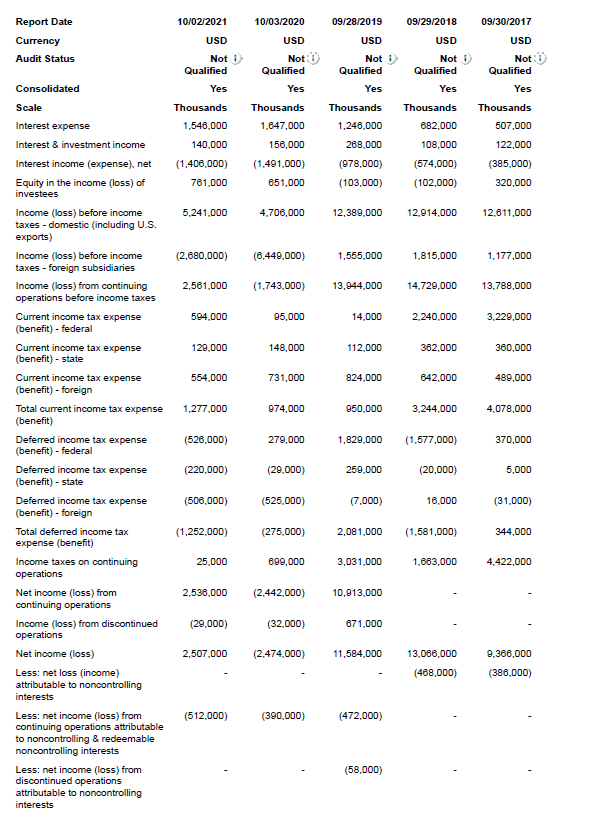
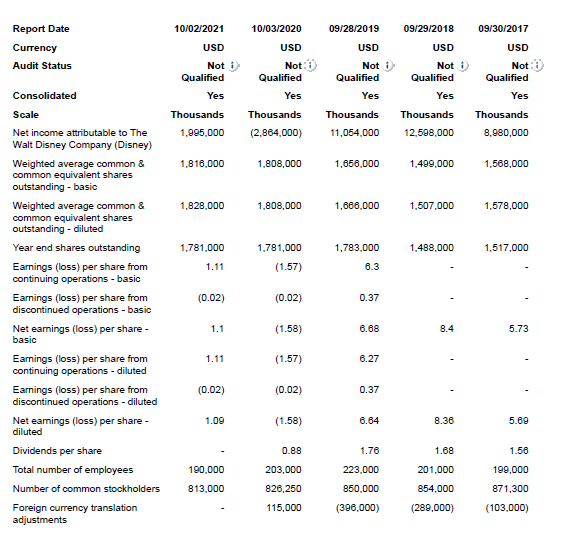
WALT DISNEY COMPANY Financial Analysis Fiscal 2017-2022 Numbers in Thousands, except where indicated* 2017 2018 2019 2020 2021 INCOME STATEMENT Total Revenues ($ actual) Total Revenues (in thousands) Total Revenues (in millions) Total Revenues (in billions) Total Revenues 1 Year Growth Ri $55,137,000,000 $55,137,000 $55,137 $55.14 7.79% Total Revenues CAGR 2017-2021 $8,980,000 Net Income (NI)** NI 1 Year Growth Rate 40.29% NMF*** Return on Sales (ROS) 16.29% Return on Assets (ROA) 9.38% Return on Equity (ROE) 19.95% EPS - Diluted ($ per share) $5.69 2017 2018 2019 2020 2021 BALANCE SHEET Current Assets Inventories (Net) Current Liabilities $15,889,000 $1,373,000 $19,595,000 Current Ratio 0.81 Quick Ratio 0.74 Total Debt (Liabilities)**** Total Assets Total Shareholder Equity $50,785,000 $95,789,000 $45,004,000 Debt to Asset Ratio (D/A) 53.02% Debt to Equity Ratio (D/E) 112.85% Total Revenues in thousands) Total Assets Fixed Assets (PP&E, Net)***** $55,137,000 $95,789,000 $28,406,000 Total Asset Turnover (TAT) 0.58 Fixed Asset Turnover (FAT) 1.94 *Walt Disney Company's Fiscal Year Ends Approximately the End of September **Use the Net Income Attributable to the Walt Disney Company (Disney) ***Not Meaningful. Dividing by a negative number makes the growth rate formula meaningless ****Calculate using the accounting formula: Assets = Liabilities + Shareholder Equity *****Use Parks, Resorts & Other Property, Net Disney Disney (Walt) Co. (The) (NYS: DIS) 10/03/2020 09/28/2019 09/29/2018 09/30/2017 USD USD USD USD Not :) Qualified Yes Not : Not :) Qualified Yes Not: Qualified Qualified Yes Yes Thousands Thousands 4.017.000 17,914,000 Thousands 5,418,000 12,882,000 2,894,000 295.000 Thousands 4,150,000 8,268,000 1,258,000 192,000 9,334.000 8.013,000 807,000 187.000 8,633,000 1,373,000 12,708,000 15,481,000 1,649.000 1.583.000 1,392,000 2.171.000 4,597.000 1,314,000 1,278,000 Powered by Chart Exchange rate used is that of the Year End reported date As Reported Annual Balance Sheet Report Date 10/02/2021 Currency USD Audit Status Not :) Qualified Consolidated Yes Scale Thousands Cash & cash equivalents 15,950,000 Accounts receivable Other receivables Allowance for doubtful accounts Receivables.net 13,367,000 Inventories 1,331,000 Content advances 2,183,000 Licensed content costs & advances Prepaid expenses Other current assets Other current assets 817.000 Total current assets 33,657.000 Produced & licensed content 29,549,000 costs Investments 3,935,000 Attractions, buildings & 32,765,000 improvements Furniture, fixtures & equipment 24,008,000 Land improvements 7,061.000 Leasehold improvements 1,058.000 Attractions, buildings & 64,892,000 equipment, at cost Accumulated depreciation 37.920,000 Parks, resorts & other property. 26.972.000 before projects in progress & land 445.000 143,000 588,000 875.000 476,000 159.000 635,000 16.825,000 7.888,000 979.000 28,124.000 22,810,000 35,251.000 25,022,000 15.889,000 7,481,000 3.903.000 3.224.000 3,202,000 2.899,000 28.995,000 31,279.000 29,509,000 28,644,000 22,976.000 8,828,000 1,028,000 62. 111.000 21.265,000 6.649,000 1,168,000 19.400,000 5,911,000 18.908,000 5.593,000 898.000 54,043,000 932.000 55,238,000 58,589,000 29,037.000 35,517,000 26,594.000 32.415.000 26,174,000 30.764,000 24,474,000 10/02/2021 10/03/2020 09/28/2019 09/29/2018 09/30/2017 Report Date Currency Audit Status USD USD :) Not Not Qualified Yes Qualified Yes USD Not Qualified Yes Thousands 4,521.000 1,131,000 32,624,000 USD Not Qualified Yes Thousands 4,284,000 1,165,000 31.803,000 Thousands 4,449,000 1,035.000 32,078,000 USD Not Qualified Yes Thousands 3.942,000 1.124.000 20.540,000 Thousands 2. 145,000 1,255,000 28.408,000 17.115.000 19,173,000 23,215,000 6.812,000 6.995,000 78,071.000 77,689,000 80,293.000 31,426,000 1.688,000 31.269,000 1.928,000 919.000 518,000 233,000 8,658,000 203.600.000 8,433,000 201,549.000 4.715,000 193,984,000 13,778,000 3,365,000 98,598,000 469,000 2,390,000 95,789,000 6.490,000 12,663.000 6.503.000 16,357,000 3,482.000 1,819,000 2.925,000 1,213,000 3.010,000 974.000 2. 189.000 787.000 1,055,000 546,000 20.894,000 16.801.000 17,762,000 9.479,000 8.855,000 Consolidated Scale Projects in progress Land Parks, resorts & other property. net Intangible assets, net Goodwill Receivables Prepaid expenses Other non-current assets Other assets Total assets Accounts payable Accounts & accrued payables Payroll & employee benefits Other accounts payable & accrued liabilities Accounts payable & other accrued liabilities Current portion of borrowings Deferred revenue & other current liabilities Total current liabilities Commercial paper U.S. & european medium-term notes BAMTech LLC acquisition payable Capital Cities/ABC, Inc. debt U.S. dollar denominated notes Foreign currency denominated debt Other borrowings Total long-term borrowings - Disney Co. Asia Theme Parks borrowings Total borrowings Less current portion Borrowings Deferred income taxes 5,866.000 8.857.000 6.172.000 5,711,000 4,116,000 3.790,000 4,591,000 4,317,000 4,722.000 4,568,000 26,628.000 31,341,000 19,595.000 31,077,000 1,992.000 17.860,000 1.005.000 2,023,000 5,342.000 2.772,000 17.942.000 19,721,000 1,581,000 103,000 105,000 49,090,000 52,736.000 39,424,000 1,044,000 2.011.000 1.983.000 955,000 13,000 583,000 62.000 (276.000) (18,000) 53,075,000 (46.000) 24.140,000 57,325.000 45,872.000 19.729,000 1,331.000 1,303,000 58,628.000 54,406.000 5.711.000 5,886,000 48,540.000 7,246.000 1,114.000 46,986,000 8,857.000 38,129.000 7.902.000 1.145,000 20,874,000 3.790,000 17.084,000 3,109,000 1.145,000 25,291,000 8.172,000 19, 119,000 4.480,000 52,917.000 7,288.000 10/03/2020 09/28/2019 09/30/2017 USD Not :) Qualified Yes USD Not : Qualified Yes 09/29/2018 USD Not: Qualified Yes Thousands 2.712,000 USD Not :) Qualified Yes Thousands 6.451.000 Thousands 4,783,000 Thousands 3.281,000 3.162.000 10,753,000 17,204.000 8,977,000 13,760.000 3.878,000 6.590,000 6,443,000 1.148.000 9,249,000 8,963.000 1,123,000 53,907,000 36.779,000 36,248,000 54,497.000 38,315.000 42,494,000 82.679,000 72,606,000 (2.000) 15,000 8,000 Report Date 10/02/2021 Currency USD Audit Status Not :) Qualified Consolidated Yes Scale Thousands Pension & postretirement 4.132.000 medical plan liabilities Operating & financing lease 3,229.000 liabilities Other long-term liabilities 7,161,000 Other long-term liabilities 14,522.000 Redeemable noncontrolling 9.213.000 interests Common stock 55,471,000 Retained earnings (accumulated 40,429,000 deficit) Market value adjustments for investments Market value adjustments for (110,000) cash flow hedges Market value adjustments Unrecognized pension & (5.372,000) postretirement medical expense Foreign currency translation & other accumulated other comprehensive income (loss) Foreign currency translation (958,000) adjustments Accumulated other (6.440,000) comprehensive income (loss) Stockholders' equity subtotal Treasury stock, at cost 907.000 Total The Walt Disney Company 88,553,000 shareholders' equity Noncontrolling interests 4,458,000 Total equity 93,011,000 102.000 145,000 (62.000) (151,000) (7.222.000) (5.748,000) (2.633,000) (3.067.000) (971.000) (624.000) (407.000) (949,000) (8.322,000) (6.617,000) (3,097.000) (3.528.000) 907.000 907.000 88,877.000 116,361,000 67.588,000 48,773,000 105,326.000 84,011,000 41.315,000 83,583.000 4,680,000 5,012.000 3,689,000 4,059,000 52.832,000 88.263.000 93,889,000 45,004,000 Diever Disney (Walt) Co. (The) (NYS: DIS) 10/03/2020 09/28/2019 09/30/2017 USD Not USD Not Qualified Yes USD Not :) Qualified Yes 09/29/2018 USD Not : Qualified Yes Not Qualified Yes Thousands Thousands Thousands Thousands (2.442.000) 10,913,000 13.066.000 9,366,000 4,160.000 3,011,000 2.782,000 5.345.000 4,953,000 (4.794.000) (560,000) (920,000) Powered by Casse Exchange rate used is that of the Year End reported date As Reported Annual Cash Flow Report Date 10/02/2021 Currency USD Audit Status Qualified Consolidated Yes Scale Thousands Net income (loss) from 2.536.000 continuing operations Depreciation & amortization 5, 111,000 Goodwill & intangible asset impairment Gain on acquisitions & dispositions Net loss (gain) on investments, (332,000) acquisitions & dispositions Loss (gains) on acquisitions & sales of investments Deferred income taxes (1,241,000) Equity in the loss (income) of (761.000) investees Cash distributions received from 754.000 equity investees Net change in produced & (4,301.000) licensed content costs & advances Net change in operating lease 46,000 right of use assets / liabilities Equity-based compensation 600,000 Pension & postretirement 816,000 medical amortization Other adjustments 144,000 Receivables (357.000) Inventories 252,000 (289.000) (1,573,000) 334,000 (392,000) (651,000) 117.000 103,000 102.000 (320.000) 774.000 754.000 775.000 788,000 397.000 (542.000) (523,000) (1,075,000) 31,000 525.000 711,000 393.000 364,000 206.000 503,000 641,000 1.943.000 55.000 441,000 (720,000) (17.000) (927.000) 14.000 (223,000) 932,000 107.000 (5.000) (52.000) Other assets 171,000 (157.000) 09/28/2019 09/29/2018 Report Date Currency Audit Status 10/02/2021 10/03/2020 USD USD Not :) Not Qualified Qualified Yes Yes Thousands Thousands USD Not :) Qualified Yes USD Not :) Qualified Yes 09/30/2017 USD Not Qualified Yes Thousands 191.000 Thousands 235.000 Thousands (388.000) 2.410,000 (2.293.000) (152,000) (6.599,000) 592.000 208,000 (282,000) 5,566,000 5,566,000 7.616.000 5,984.000 14,295,000 12.343,000 (3,578,000) (4,022,000) (4.876.000) (4.465,000) (3.623.000) (9.901.000) (319,000) (1.581.000) 710.000 (417,000) (71.000) 407.000 172.000 (3.171.000) (3.171,000) (3.850.000) (15,096,000) (5.336,000) (4.111.000) (26.000) (3.354,000) 4,318.000 (1,788,000) 1,247,000 Consolidated Scale Accounts payable & other accrued liabilities Accounts payable & other liabilities Income taxes Net cash flows from operating activities - continuing operations Net cash flows from operating activities Investments in parks, resorts & other property Acquisitions Other investing activities Net cash flows from investing activities - continuing operations Net cash flows from investing activities Commercial paper borrowings (payments), net Borrowings Reduction of borrowings Dividends Repurchases of common stock Proceeds from exercise of stock options Contributions from or sales of noncontrolling interests Acquisitions of noncontrolling & redeemable noncontrolling interests Other financing activities Net cash flows from financing actvities - continuing operations Net cash flows from financing actvities Cash flows from operating activities of discontinued operations Cash flows from investing activities of discontinued operations Cash flows from financing activities of discontinued operations 84,000 (3.737.000) 18. 120.000 (3.533,000) (1.587.000) 38.240.000 (38.881,000) (2.895,000) 1,056.000 (1.871.000) (2.515.000) (3,577,000) 210.000 4.820.000 (2,364,000) (2.445,000) (9,368,000) 276,000 435,000 305.000 318.000 91.000 94.000 737.000 399.000 17,000 (350,000) (1.430,000) (862.000) (1,565,000) (871,000) (777,000) (1.142.000) (4.385,000) (4.385,000) 8.480.000 (464.000) (8.843,000) (8,950.000) 1,000 2,000 622.000 8.000 213,000 10,978,000 (626,000) Report Date 10/02/2021 10/03/2020 09/28/2019 09/29/2018 09/30/2017 USD USD Currency Audit Status USD USD Not :) Not Qualified Qualified Yes Yes Thousands Thousands 9,000 215.000 Not Qualified Yes Thousands 10,974,000 Not: Qualified Yes Thousands USD Not :) Qualified Yes Thousands 30,000 38.000 (98.000) (25,000) 31,000 Consolidated Scale Cash from (used in) discontinued operations Impact of exchange rates on cash, cash equivalents & restricted cash Change in cash, cash equivalents & restricted cash Cash, cash equivalents & restricted cash, beginning of year Cash, cash equivalents & restricted cash, end of year Interest paid Income taxes paid (1.951,000) 12.499,000 1,300,000 91,000 (696,000) 17,954,000 5.455.000 4,155.000 4.064.000 4,760,000 16,003,000 17,954,000 5,455,000 4.155.000 4,064,000 1.892,000 1.559.000 1.142.000 468,000 631.000 2.503.000 1.638,000 738.000 9,259,000 3.801.000 Disney Disney (Walt) Co. (The) (NYS: DIS) 09/28/2019 09/30/2017 10/03/2020 USD USD Not :) Qualified Yes USD Not Qualified Yes 09/29/2018 USD Not :) Qualified Yes Not Qualified Yes Thousands Thousands Thousands 60.542.000 50.869,000 59,265,000 6,123,000 8.565,000 Thousands 46.843,000 8.294,000 55,137,000 25.320.000 9,028,000 69,570.000 36,450,000 65,388,000 59,434.000 39.406,000 27.528,000 4.474,000 5,568,000 5.198.000 4,986,000 12.369,000 11,541,000 8.860,000 8,178,000 Powered by Cest Exchange rate used is that of the Year End reported date As Reported Annual Income Statement Report Date 10/02/2021 Currency USD Audit Status Not : Qualified Consolidated Yes Scale Thousands Revenues - Services 61.768.000 Revenues - products 5,650,000 Total revenues 67.418.000 Cost of services (exclusive of 41,129.000 depreciation & amortization) Cost of products (exclusive of 4.002.000 depreciation & amortization) Selling, general, administrative & 13,517.000 other expenses Depreciation & amortization 5.111.000 Total costs & expenses (63,750,000) Restructuring & impairment 654.000 charges Hulu LLC ("Hulu") gain DraftKings gain (loss) (111,000) fubo TV gain 188.000 German FTA gain 126,000 Charge for the extinguishment of a portion of the debt originally assumed in the TFCF acquisition Insurance recoveries (settlements) related to legal matters Gains on sale of real estate, property rights & other Gain related to the acquisition of BAMTech LLC Gain on sale of an investment 5,345,000 3,011,000 2,782,000 4,160,000 (57.719,000) 41,264,000 (61,594.000) 5.735,000 44.597.000 33.000 1,183,000 98,000 4,794.000 973,000 (511,000) (48,000) (38,000) 177.000 28,000 560.000 3.000 255,000 65,000 Other income (expense), net 201.000 1,038,000 4,357.000 601,000 78.000 10/02/2021 10/03/2020 09/28/2019 09/29/2018 09/30/2017 Report Date Currency Audit Status USD Not: Qualified Yes USD Not :) Qualified Yes Thousands 1,546,000 140.000 (1.400.000) 761.000 Thousands 1.847,000 156,000 (1.491,000) 651,000 USD Not Qualified Yes Thousands 1.246,000 268.000 (978,000) (103.000) USD Not Qualified Yes Thousands 682.000 108.000 (574.000) (102,000) USD Not :) Qualified Yes Thousands 507.000 122,000 (385.000) 320,000 5,241,000 4.706,000 12,389.000 12.914,000 12.611,000 (2.680,000) (6.449,000) 1,555.000 1.815.000 1.177.000 2,561,000 (1.743,000) 13,944.000 14,729,000 13,788,000 594.000 95,000 14,000 2.240.000 3,229,000 129.000 148,000 112.000 362.000 360,000 554,000 731,000 824.000 642.000 480,000 1,277.000 974,000 950.000 3.244.000 4,078,000 Consolidated Scale Interest expense Interest & investment income Interest income (expense), net Equity in the income (loss) of investees Income (loss) before income taxes - domestic (including U.S. exports) Income (loss) before income taxes - foreign subsidiaries Income (loss) from continuing operations before income taxes Current income tax expense (benefit) - federal Current income tax expense (benefit) - state Current income tax expense (benefit) - foreign Total current income tax expense (benefit) Deferred income tax expense (benefit) - federal Deferred income tax expense (benefit) - state Deferred income tax expense (benefit) - foreign Total deferred income tax expense (benefit) Income taxes on continuing operations Net income (loss) from continuing operations Income (loss) from discontinued operations Net income (loss) Less: net loss (income) attributable to noncontrolling interests Less: net income (loss) from continuing operations attributable to noncontrolling & redeemable noncontrolling interests Less: net income (loss) from discontinued operations attributable to noncontrolling interests (526,000) 279.000 1,829,000 (1,577,000) 370.000 (220,000) (29,000) 259.000 (20,000) 5,000 (506,000) (525.000) (7.000) 16.000 (31.000) (1,252,000) (275.000) 2,081,000 (1.581.000) 344,000 25.000 699,000 3,031.000 1,663,000 4,422,000 2.536.000 (2.442.000) 10.913,000 (29.000) (32,000) 671.000 2,507.000 (2.474,000) 11,584,000 13.066.000 9,368,000 (386.000) (468,000) (512.000) (390.000) (472.000) (58.000) 09/28/2019 09/30/2017 Report Date Currency Audit Status USD 10/02/2021 USD Not :) Qualified Yes Thousands 1.995.000 10/03/2020 USD Not: Qualified Yes USD Not Qualified Yes Thousands 11,054.000 09/29/2018 USD Not Qualified Yes Thousands 12,598.000 Not Qualified Yes Thousands (2.864.000) Thousands 8.980,000 1,816.000 1.808,000 1,656.000 1.499,000 1,568,000 1,828.000 1.808,000 1,666.000 1.507.000 1,578,000 1.781.000 1.781,000 1,783,000 1.488.000 1.517.000 1.11 (1.57) 8.3 (0.02) (0.02) 0.37 Consolidated Scale Net income attributable to The Walt Disney Company (Disney) Weighted average common & common equivalent shares outstanding - basic Weighted average common & common equivalent shares outstanding - diluted Year end shares outstanding Earnings (loss) per share from continuing operations - basic Earnings (loss) per share from discontinued operations - basic Net earnings (loss) per share basic Earnings (loss) per share from continuing operations - diluted Earnings (loss) per share from discontinued operations - diluted Net earnings (loss) per share - diluted Dividends per share Total number of employees Number of common stockholders Foreign currency translation adjustments 1.1 (1.58) 6.68 8.4 5.73 1.11 (1.57) 6.27 (0.02) (0.02) 0.37 1.09 (1.58) 6.64 8.36 5.69 0.88 1.76 1.68 1.56 203,000 223.000 201.000 190.000 813.000 826.250 850.000 (396.000) 854,000 (289,000) 199,000 871,300 (103.000) 115,000 WALT DISNEY COMPANY Financial Analysis Fiscal 2017-2022 Numbers in Thousands, except where indicated* 2017 2018 2019 2020 2021 INCOME STATEMENT Total Revenues ($ actual) Total Revenues (in thousands) Total Revenues (in millions) Total Revenues (in billions) Total Revenues 1 Year Growth Ri $55,137,000,000 $55,137,000 $55,137 $55.14 7.79% Total Revenues CAGR 2017-2021 $8,980,000 Net Income (NI)** NI 1 Year Growth Rate 40.29% NMF*** Return on Sales (ROS) 16.29% Return on Assets (ROA) 9.38% Return on Equity (ROE) 19.95% EPS - Diluted ($ per share) $5.69 2017 2018 2019 2020 2021 BALANCE SHEET Current Assets Inventories (Net) Current Liabilities $15,889,000 $1,373,000 $19,595,000 Current Ratio 0.81 Quick Ratio 0.74 Total Debt (Liabilities)**** Total Assets Total Shareholder Equity $50,785,000 $95,789,000 $45,004,000 Debt to Asset Ratio (D/A) 53.02% Debt to Equity Ratio (D/E) 112.85% Total Revenues in thousands) Total Assets Fixed Assets (PP&E, Net)***** $55,137,000 $95,789,000 $28,406,000 Total Asset Turnover (TAT) 0.58 Fixed Asset Turnover (FAT) 1.94 *Walt Disney Company's Fiscal Year Ends Approximately the End of September **Use the Net Income Attributable to the Walt Disney Company (Disney) ***Not Meaningful. Dividing by a negative number makes the growth rate formula meaningless ****Calculate using the accounting formula: Assets = Liabilities + Shareholder Equity *****Use Parks, Resorts & Other Property, Net Disney Disney (Walt) Co. (The) (NYS: DIS) 10/03/2020 09/28/2019 09/29/2018 09/30/2017 USD USD USD USD Not :) Qualified Yes Not : Not :) Qualified Yes Not: Qualified Qualified Yes Yes Thousands Thousands 4.017.000 17,914,000 Thousands 5,418,000 12,882,000 2,894,000 295.000 Thousands 4,150,000 8,268,000 1,258,000 192,000 9,334.000 8.013,000 807,000 187.000 8,633,000 1,373,000 12,708,000 15,481,000 1,649.000 1.583.000 1,392,000 2.171.000 4,597.000 1,314,000 1,278,000 Powered by Chart Exchange rate used is that of the Year End reported date As Reported Annual Balance Sheet Report Date 10/02/2021 Currency USD Audit Status Not :) Qualified Consolidated Yes Scale Thousands Cash & cash equivalents 15,950,000 Accounts receivable Other receivables Allowance for doubtful accounts Receivables.net 13,367,000 Inventories 1,331,000 Content advances 2,183,000 Licensed content costs & advances Prepaid expenses Other current assets Other current assets 817.000 Total current assets 33,657.000 Produced & licensed content 29,549,000 costs Investments 3,935,000 Attractions, buildings & 32,765,000 improvements Furniture, fixtures & equipment 24,008,000 Land improvements 7,061.000 Leasehold improvements 1,058.000 Attractions, buildings & 64,892,000 equipment, at cost Accumulated depreciation 37.920,000 Parks, resorts & other property. 26.972.000 before projects in progress & land 445.000 143,000 588,000 875.000 476,000 159.000 635,000 16.825,000 7.888,000 979.000 28,124.000 22,810,000 35,251.000 25,022,000 15.889,000 7,481,000 3.903.000 3.224.000 3,202,000 2.899,000 28.995,000 31,279.000 29,509,000 28,644,000 22,976.000 8,828,000 1,028,000 62. 111.000 21.265,000 6.649,000 1,168,000 19.400,000 5,911,000 18.908,000 5.593,000 898.000 54,043,000 932.000 55,238,000 58,589,000 29,037.000 35,517,000 26,594.000 32.415.000 26,174,000 30.764,000 24,474,000 10/02/2021 10/03/2020 09/28/2019 09/29/2018 09/30/2017 Report Date Currency Audit Status USD USD :) Not Not Qualified Yes Qualified Yes USD Not Qualified Yes Thousands 4,521.000 1,131,000 32,624,000 USD Not Qualified Yes Thousands 4,284,000 1,165,000 31.803,000 Thousands 4,449,000 1,035.000 32,078,000 USD Not Qualified Yes Thousands 3.942,000 1.124.000 20.540,000 Thousands 2. 145,000 1,255,000 28.408,000 17.115.000 19,173,000 23,215,000 6.812,000 6.995,000 78,071.000 77,689,000 80,293.000 31,426,000 1.688,000 31.269,000 1.928,000 919.000 518,000 233,000 8,658,000 203.600.000 8,433,000 201,549.000 4.715,000 193,984,000 13,778,000 3,365,000 98,598,000 469,000 2,390,000 95,789,000 6.490,000 12,663.000 6.503.000 16,357,000 3,482.000 1,819,000 2.925,000 1,213,000 3.010,000 974.000 2. 189.000 787.000 1,055,000 546,000 20.894,000 16.801.000 17,762,000 9.479,000 8.855,000 Consolidated Scale Projects in progress Land Parks, resorts & other property. net Intangible assets, net Goodwill Receivables Prepaid expenses Other non-current assets Other assets Total assets Accounts payable Accounts & accrued payables Payroll & employee benefits Other accounts payable & accrued liabilities Accounts payable & other accrued liabilities Current portion of borrowings Deferred revenue & other current liabilities Total current liabilities Commercial paper U.S. & european medium-term notes BAMTech LLC acquisition payable Capital Cities/ABC, Inc. debt U.S. dollar denominated notes Foreign currency denominated debt Other borrowings Total long-term borrowings - Disney Co. Asia Theme Parks borrowings Total borrowings Less current portion Borrowings Deferred income taxes 5,866.000 8.857.000 6.172.000 5,711,000 4,116,000 3.790,000 4,591,000 4,317,000 4,722.000 4,568,000 26,628.000 31,341,000 19,595.000 31,077,000 1,992.000 17.860,000 1.005.000 2,023,000 5,342.000 2.772,000 17.942.000 19,721,000 1,581,000 103,000 105,000 49,090,000 52,736.000 39,424,000 1,044,000 2.011.000 1.983.000 955,000 13,000 583,000 62.000 (276.000) (18,000) 53,075,000 (46.000) 24.140,000 57,325.000 45,872.000 19.729,000 1,331.000 1,303,000 58,628.000 54,406.000 5.711.000 5,886,000 48,540.000 7,246.000 1,114.000 46,986,000 8,857.000 38,129.000 7.902.000 1.145,000 20,874,000 3.790,000 17.084,000 3,109,000 1.145,000 25,291,000 8.172,000 19, 119,000 4.480,000 52,917.000 7,288.000 10/03/2020 09/28/2019 09/30/2017 USD Not :) Qualified Yes USD Not : Qualified Yes 09/29/2018 USD Not: Qualified Yes Thousands 2.712,000 USD Not :) Qualified Yes Thousands 6.451.000 Thousands 4,783,000 Thousands 3.281,000 3.162.000 10,753,000 17,204.000 8,977,000 13,760.000 3.878,000 6.590,000 6,443,000 1.148.000 9,249,000 8,963.000 1,123,000 53,907,000 36.779,000 36,248,000 54,497.000 38,315.000 42,494,000 82.679,000 72,606,000 (2.000) 15,000 8,000 Report Date 10/02/2021 Currency USD Audit Status Not :) Qualified Consolidated Yes Scale Thousands Pension & postretirement 4.132.000 medical plan liabilities Operating & financing lease 3,229.000 liabilities Other long-term liabilities 7,161,000 Other long-term liabilities 14,522.000 Redeemable noncontrolling 9.213.000 interests Common stock 55,471,000 Retained earnings (accumulated 40,429,000 deficit) Market value adjustments for investments Market value adjustments for (110,000) cash flow hedges Market value adjustments Unrecognized pension & (5.372,000) postretirement medical expense Foreign currency translation & other accumulated other comprehensive income (loss) Foreign currency translation (958,000) adjustments Accumulated other (6.440,000) comprehensive income (loss) Stockholders' equity subtotal Treasury stock, at cost 907.000 Total The Walt Disney Company 88,553,000 shareholders' equity Noncontrolling interests 4,458,000 Total equity 93,011,000 102.000 145,000 (62.000) (151,000) (7.222.000) (5.748,000) (2.633,000) (3.067.000) (971.000) (624.000) (407.000) (949,000) (8.322,000) (6.617,000) (3,097.000) (3.528.000) 907.000 907.000 88,877.000 116,361,000 67.588,000 48,773,000 105,326.000 84,011,000 41.315,000 83,583.000 4,680,000 5,012.000 3,689,000 4,059,000 52.832,000 88.263.000 93,889,000 45,004,000 Diever Disney (Walt) Co. (The) (NYS: DIS) 10/03/2020 09/28/2019 09/30/2017 USD Not USD Not Qualified Yes USD Not :) Qualified Yes 09/29/2018 USD Not : Qualified Yes Not Qualified Yes Thousands Thousands Thousands Thousands (2.442.000) 10,913,000 13.066.000 9,366,000 4,160.000 3,011,000 2.782,000 5.345.000 4,953,000 (4.794.000) (560,000) (920,000) Powered by Casse Exchange rate used is that of the Year End reported date As Reported Annual Cash Flow Report Date 10/02/2021 Currency USD Audit Status Qualified Consolidated Yes Scale Thousands Net income (loss) from 2.536.000 continuing operations Depreciation & amortization 5, 111,000 Goodwill & intangible asset impairment Gain on acquisitions & dispositions Net loss (gain) on investments, (332,000) acquisitions & dispositions Loss (gains) on acquisitions & sales of investments Deferred income taxes (1,241,000) Equity in the loss (income) of (761.000) investees Cash distributions received from 754.000 equity investees Net change in produced & (4,301.000) licensed content costs & advances Net change in operating lease 46,000 right of use assets / liabilities Equity-based compensation 600,000 Pension & postretirement 816,000 medical amortization Other adjustments 144,000 Receivables (357.000) Inventories 252,000 (289.000) (1,573,000) 334,000 (392,000) (651,000) 117.000 103,000 102.000 (320.000) 774.000 754.000 775.000 788,000 397.000 (542.000) (523,000) (1,075,000) 31,000 525.000 711,000 393.000 364,000 206.000 503,000 641,000 1.943.000 55.000 441,000 (720,000) (17.000) (927.000) 14.000 (223,000) 932,000 107.000 (5.000) (52.000) Other assets 171,000 (157.000) 09/28/2019 09/29/2018 Report Date Currency Audit Status 10/02/2021 10/03/2020 USD USD Not :) Not Qualified Qualified Yes Yes Thousands Thousands USD Not :) Qualified Yes USD Not :) Qualified Yes 09/30/2017 USD Not Qualified Yes Thousands 191.000 Thousands 235.000 Thousands (388.000) 2.410,000 (2.293.000) (152,000) (6.599,000) 592.000 208,000 (282,000) 5,566,000 5,566,000 7.616.000 5,984.000 14,295,000 12.343,000 (3,578,000) (4,022,000) (4.876.000) (4.465,000) (3.623.000) (9.901.000) (319,000) (1.581.000) 710.000 (417,000) (71.000) 407.000 172.000 (3.171.000) (3.171,000) (3.850.000) (15,096,000) (5.336,000) (4.111.000) (26.000) (3.354,000) 4,318.000 (1,788,000) 1,247,000 Consolidated Scale Accounts payable & other accrued liabilities Accounts payable & other liabilities Income taxes Net cash flows from operating activities - continuing operations Net cash flows from operating activities Investments in parks, resorts & other property Acquisitions Other investing activities Net cash flows from investing activities - continuing operations Net cash flows from investing activities Commercial paper borrowings (payments), net Borrowings Reduction of borrowings Dividends Repurchases of common stock Proceeds from exercise of stock options Contributions from or sales of noncontrolling interests Acquisitions of noncontrolling & redeemable noncontrolling interests Other financing activities Net cash flows from financing actvities - continuing operations Net cash flows from financing actvities Cash flows from operating activities of discontinued operations Cash flows from investing activities of discontinued operations Cash flows from financing activities of discontinued operations 84,000 (3.737.000) 18. 120.000 (3.533,000) (1.587.000) 38.240.000 (38.881,000) (2.895,000) 1,056.000 (1.871.000) (2.515.000) (3,577,000) 210.000 4.820.000 (2,364,000) (2.445,000) (9,368,000) 276,000 435,000 305.000 318.000 91.000 94.000 737.000 399.000 17,000 (350,000) (1.430,000) (862.000) (1,565,000) (871,000) (777,000) (1.142.000) (4.385,000) (4.385,000) 8.480.000 (464.000) (8.843,000) (8,950.000) 1,000 2,000 622.000 8.000 213,000 10,978,000 (626,000) Report Date 10/02/2021 10/03/2020 09/28/2019 09/29/2018 09/30/2017 USD USD Currency Audit Status USD USD Not :) Not Qualified Qualified Yes Yes Thousands Thousands 9,000 215.000 Not Qualified Yes Thousands 10,974,000 Not: Qualified Yes Thousands USD Not :) Qualified Yes Thousands 30,000 38.000 (98.000) (25,000) 31,000 Consolidated Scale Cash from (used in) discontinued operations Impact of exchange rates on cash, cash equivalents & restricted cash Change in cash, cash equivalents & restricted cash Cash, cash equivalents & restricted cash, beginning of year Cash, cash equivalents & restricted cash, end of year Interest paid Income taxes paid (1.951,000) 12.499,000 1,300,000 91,000 (696,000) 17,954,000 5.455.000 4,155.000 4.064.000 4,760,000 16,003,000 17,954,000 5,455,000 4.155.000 4,064,000 1.892,000 1.559.000 1.142.000 468,000 631.000 2.503.000 1.638,000 738.000 9,259,000 3.801.000 Disney Disney (Walt) Co. (The) (NYS: DIS) 09/28/2019 09/30/2017 10/03/2020 USD USD Not :) Qualified Yes USD Not Qualified Yes 09/29/2018 USD Not :) Qualified Yes Not Qualified Yes Thousands Thousands Thousands 60.542.000 50.869,000 59,265,000 6,123,000 8.565,000 Thousands 46.843,000 8.294,000 55,137,000 25.320.000 9,028,000 69,570.000 36,450,000 65,388,000 59,434.000 39.406,000 27.528,000 4.474,000 5,568,000 5.198.000 4,986,000 12.369,000 11,541,000 8.860,000 8,178,000 Powered by Cest Exchange rate used is that of the Year End reported date As Reported Annual Income Statement Report Date 10/02/2021 Currency USD Audit Status Not : Qualified Consolidated Yes Scale Thousands Revenues - Services 61.768.000 Revenues - products 5,650,000 Total revenues 67.418.000 Cost of services (exclusive of 41,129.000 depreciation & amortization) Cost of products (exclusive of 4.002.000 depreciation & amortization) Selling, general, administrative & 13,517.000 other expenses Depreciation & amortization 5.111.000 Total costs & expenses (63,750,000) Restructuring & impairment 654.000 charges Hulu LLC ("Hulu") gain DraftKings gain (loss) (111,000) fubo TV gain 188.000 German FTA gain 126,000 Charge for the extinguishment of a portion of the debt originally assumed in the TFCF acquisition Insurance recoveries (settlements) related to legal matters Gains on sale of real estate, property rights & other Gain related to the acquisition of BAMTech LLC Gain on sale of an investment 5,345,000 3,011,000 2,782,000 4,160,000 (57.719,000) 41,264,000 (61,594.000) 5.735,000 44.597.000 33.000 1,183,000 98,000 4,794.000 973,000 (511,000) (48,000) (38,000) 177.000 28,000 560.000 3.000 255,000 65,000 Other income (expense), net 201.000 1,038,000 4,357.000 601,000 78.000 10/02/2021 10/03/2020 09/28/2019 09/29/2018 09/30/2017 Report Date Currency Audit Status USD Not: Qualified Yes USD Not :) Qualified Yes Thousands 1,546,000 140.000 (1.400.000) 761.000 Thousands 1.847,000 156,000 (1.491,000) 651,000 USD Not Qualified Yes Thousands 1.246,000 268.000 (978,000) (103.000) USD Not Qualified Yes Thousands 682.000 108.000 (574.000) (102,000) USD Not :) Qualified Yes Thousands 507.000 122,000 (385.000) 320,000 5,241,000 4.706,000 12,389.000 12.914,000 12.611,000 (2.680,000) (6.449,000) 1,555.000 1.815.000 1.177.000 2,561,000 (1.743,000) 13,944.000 14,729,000 13,788,000 594.000 95,000 14,000 2.240.000 3,229,000 129.000 148,000 112.000 362.000 360,000 554,000 731,000 824.000 642.000 480,000 1,277.000 974,000 950.000 3.244.000 4,078,000 Consolidated Scale Interest expense Interest & investment income Interest income (expense), net Equity in the income (loss) of investees Income (loss) before income taxes - domestic (including U.S. exports) Income (loss) before income taxes - foreign subsidiaries Income (loss) from continuing operations before income taxes Current income tax expense (benefit) - federal Current income tax expense (benefit) - state Current income tax expense (benefit) - foreign Total current income tax expense (benefit) Deferred income tax expense (benefit) - federal Deferred income tax expense (benefit) - state Deferred income tax expense (benefit) - foreign Total deferred income tax expense (benefit) Income taxes on continuing operations Net income (loss) from continuing operations Income (loss) from discontinued operations Net income (loss) Less: net loss (income) attributable to noncontrolling interests Less: net income (loss) from continuing operations attributable to noncontrolling & redeemable noncontrolling interests Less: net income (loss) from discontinued operations attributable to noncontrolling interests (526,000) 279.000 1,829,000 (1,577,000) 370.000 (220,000) (29,000) 259.000 (20,000) 5,000 (506,000) (525.000) (7.000) 16.000 (31.000) (1,252,000) (275.000) 2,081,000 (1.581.000) 344,000 25.000 699,000 3,031.000 1,663,000 4,422,000 2.536.000 (2.442.000) 10.913,000 (29.000) (32,000) 671.000 2,507.000 (2.474,000) 11,584,000 13.066.000 9,368,000 (386.000) (468,000) (512.000) (390.000) (472.000) (58.000) 09/28/2019 09/30/2017 Report Date Currency Audit Status USD 10/02/2021 USD Not :) Qualified Yes Thousands 1.995.000 10/03/2020 USD Not: Qualified Yes USD Not Qualified Yes Thousands 11,054.000 09/29/2018 USD Not Qualified Yes Thousands 12,598.000 Not Qualified Yes Thousands (2.864.000) Thousands 8.980,000 1,816.000 1.808,000 1,656.000 1.499,000 1,568,000 1,828.000 1.808,000 1,666.000 1.507.000 1,578,000 1.781.000 1.781,000 1,783,000 1.488.000 1.517.000 1.11 (1.57) 8.3 (0.02) (0.02) 0.37 Consolidated Scale Net income attributable to The Walt Disney Company (Disney) Weighted average common & common equivalent shares outstanding - basic Weighted average common & common equivalent shares outstanding - diluted Year end shares outstanding Earnings (loss) per share from continuing operations - basic Earnings (loss) per share from discontinued operations - basic Net earnings (loss) per share basic Earnings (loss) per share from continuing operations - diluted Earnings (loss) per share from discontinued operations - diluted Net earnings (loss) per share - diluted Dividends per share Total number of employees Number of common stockholders Foreign currency translation adjustments 1.1 (1.58) 6.68 8.4 5.73 1.11 (1.57) 6.27 (0.02) (0.02) 0.37 1.09 (1.58) 6.64 8.36 5.69 0.88 1.76 1.68 1.56 203,000 223.000 201.000 190.000 813.000 826.250 850.000 (396.000) 854,000 (289,000) 199,000 871,300 (103.000) 115,000


