

Answered step by step
Verified Expert Solution
Question
1 Approved Answer
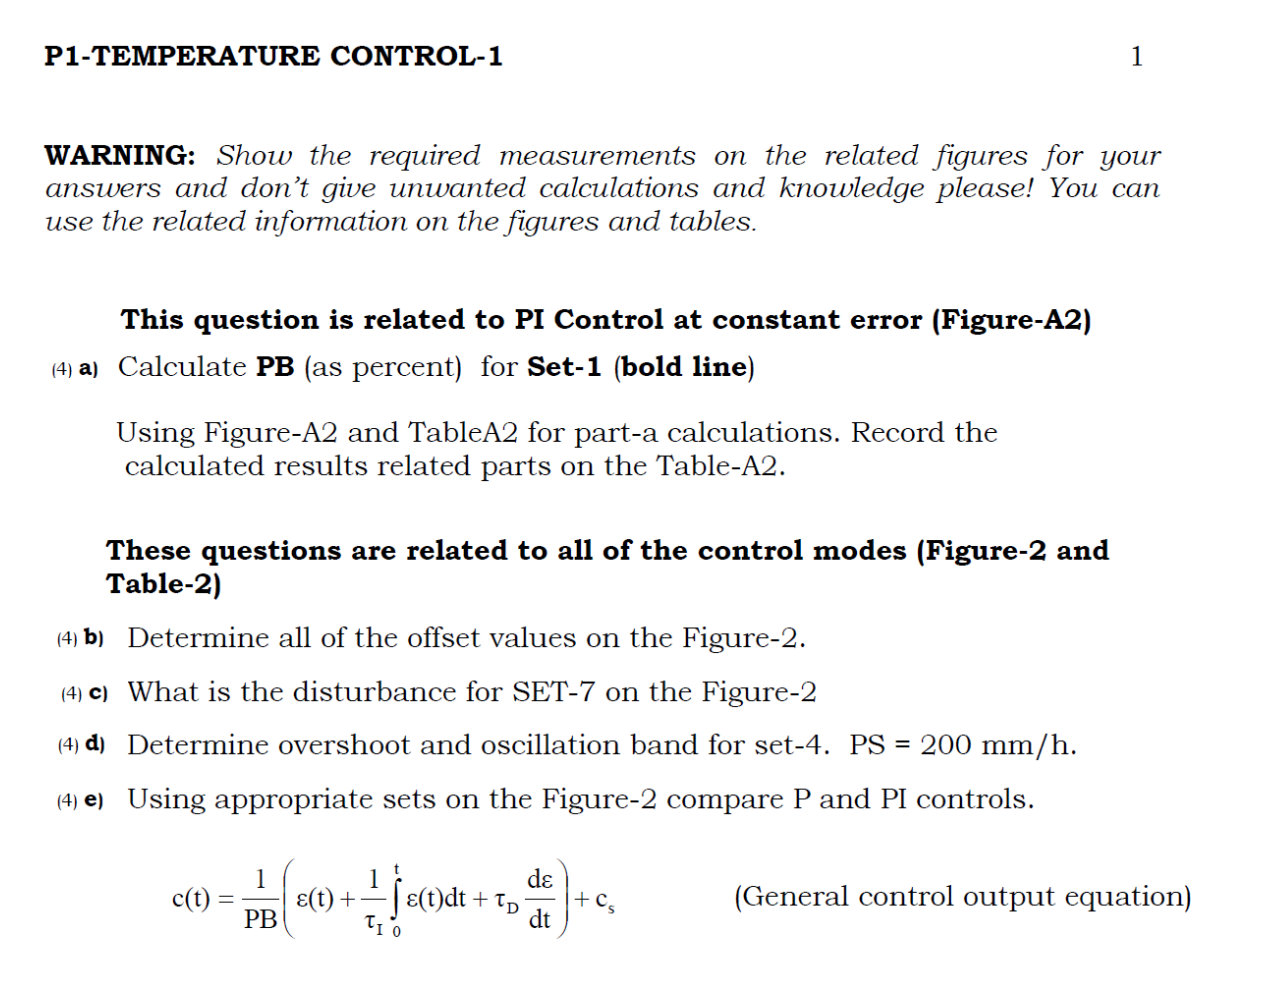
WARNING: Show the required measurements on the related figures for your answers and don't give unwanted calculations and knowledge please! You can use the related
WARNING: Show the required measurements on the related figures for your
answers and don't give unwanted calculations and knowledge please! You can
use the related information on the figures and tables.
This question is related to PI Control at constant error FigureA
a Calculate PB as percent for Setbold line
Using FigureA and TableA for parta calculations. Record the
calculated results related parts on the TableA
These questions are related to all of the control modes Figure and
Table
b Determine all of the offset values on the Figure
c What is the disturbance for SET on the Figure
d Determine overshoot and oscillation band for set
e Using appropriate sets on the Figure compare P and PI controls.
General control output equation Controller Output
graph at constant error. This figure is related to TableA
Table A PI Control at constant error
controller response, Heater OFF Figure P&PD&PI Control under step change in SP PSmmh
Table P&PD&PI Control of heater under Step Function
Step by Step Solution
There are 3 Steps involved in it
Step: 1

Get Instant Access to Expert-Tailored Solutions
See step-by-step solutions with expert insights and AI powered tools for academic success
Step: 2

Step: 3
Ace Your Homework with AI
Get the answers you need in no time with our AI-driven, step-by-step assistance
Get Started
Heat And Mass Transfer Fundamentals And Applications
Authors: Yunus Cengel, Afshin Ghajar
6th Edition
0073398195, 978-0073398198