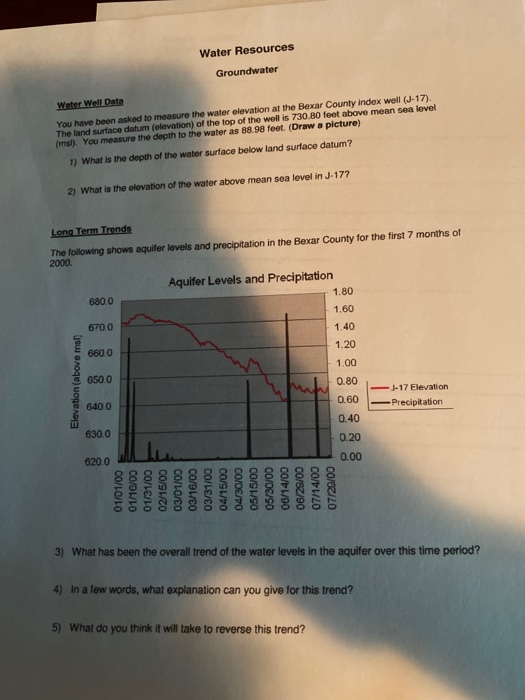
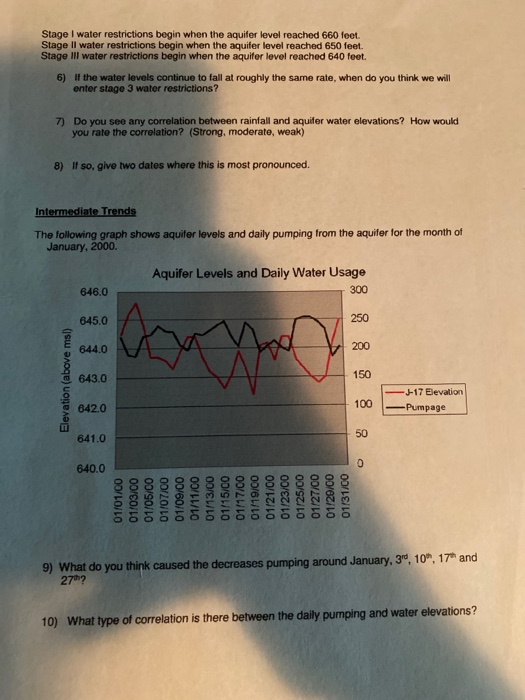
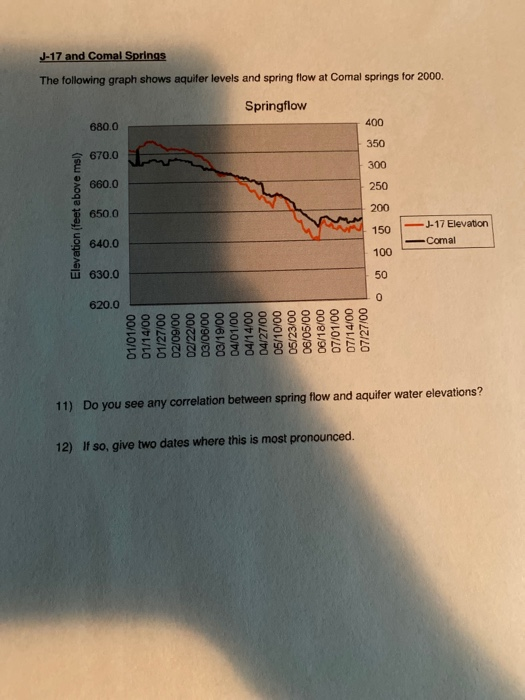
Water Resources Groundwater Water Well Data You have been asked to measure the water elevation at the Bexar County index well (J-17). The land surface datum (elevation) of the top of the well is 730.80 feet above mean sea level (ms). You measure the depth to the water as 88.98 feet. (Draw a picture) 1) What is the depth of the water surface below land surface datum? 2) What is the elevation of the water above mean sea level in J-177 Long Term Trends The following shows aquiler levels and precipitation in the Bexar County for the first 7 months of 2000 680.0 Aquifer Levels and Precipitation 1.80 1.60 1.40 1.20 6700 Elevation (above msl) 0.80 0.60 -J-17 Elevation Precipitation - 0.40 0.20 0.00 CO/LO/LO 01/16/00 01/31/00 02/15/00 03/01/00 03/16/00 03/31/00 CO/SL/VO CO/DE/DO CO/SL/SO 05/30/00 06/14/05 CO/62/90 07/14/00 07/20/00 3) What has been the overall trend of the water levels in the aquifer over this time period? 4) In a few words, what explanation can you give for this trend? 5) What do you think it will take to reverse this trend? Stage I water restrictions begin when the aquifer level reached 660 feet. Stage Il water restrictions begin when the aquifer level reached 650 feet. Stage Ill water restrictions begin when the aquifer level reached 640 feet. 6) If the water levels continue to fall at roughly the same rate, when do you think we will enter stage 3 water restrictions? 7) Do you see any correlation between rainfall and aquifer water elevations? How would you rate the correlation? (Strong, moderate, weak) 8) If so, give two dates where this is most pronounced. Intermediate Trends The following graph shows aquifer levels and daily pumping from the aquifer for the month of January, 2000. Aquifer Levels and Daily Water Usage 646.0 645.0 644.0 Elevation (above msl) -J-17 Elevation Pumpage 642.0 641.0 640.0 01/01/00 01/03/00 01/05/00 01/07/00 01/09/00 01/11/00 01/13/00 01/15/00 01/17/00 01/19/00 01/21,00 01/23/00 01/25/00 01/27/00 01/29/00 01/31/00 9) What do you think caused the decreases pumping around January 30, 10", 17" and 27h? 10) What type of correlation is there between the daily pumping and water elevations? Elevation (feet above msl) 620.0 630.0 640.0 660.0 670.0 680.0 J-17 and Comal Springs 12) If so, give two dates where this is most pronounced. 11) Do you see any correlation between spring flow and aquifer water elevations? 01/01/00 01/14/00 01/27/00 02/09/00 02/22/00 03/06/00 03/19/00 04/01/00 04/14/00 04/27/00 05/10/00 05/23/00 06/05/00 06/18/00 07/01/00 07/14/00 07/27/00 The following graph shows aquifer levels and spring flow at Comal springs for 2000. Springflow 300 350 400 -Comal -J-17 Elevation Water Resources Groundwater Water Well Data You have been asked to measure the water elevation at the Bexar County index well (J-17). The land surface datum (elevation) of the top of the well is 730.80 feet above mean sea level (ms). You measure the depth to the water as 88.98 feet. (Draw a picture) 1) What is the depth of the water surface below land surface datum? 2) What is the elevation of the water above mean sea level in J-177 Long Term Trends The following shows aquiler levels and precipitation in the Bexar County for the first 7 months of 2000 680.0 Aquifer Levels and Precipitation 1.80 1.60 1.40 1.20 6700 Elevation (above msl) 0.80 0.60 -J-17 Elevation Precipitation - 0.40 0.20 0.00 CO/LO/LO 01/16/00 01/31/00 02/15/00 03/01/00 03/16/00 03/31/00 CO/SL/VO CO/DE/DO CO/SL/SO 05/30/00 06/14/05 CO/62/90 07/14/00 07/20/00 3) What has been the overall trend of the water levels in the aquifer over this time period? 4) In a few words, what explanation can you give for this trend? 5) What do you think it will take to reverse this trend? Stage I water restrictions begin when the aquifer level reached 660 feet. Stage Il water restrictions begin when the aquifer level reached 650 feet. Stage Ill water restrictions begin when the aquifer level reached 640 feet. 6) If the water levels continue to fall at roughly the same rate, when do you think we will enter stage 3 water restrictions? 7) Do you see any correlation between rainfall and aquifer water elevations? How would you rate the correlation? (Strong, moderate, weak) 8) If so, give two dates where this is most pronounced. Intermediate Trends The following graph shows aquifer levels and daily pumping from the aquifer for the month of January, 2000. Aquifer Levels and Daily Water Usage 646.0 645.0 644.0 Elevation (above msl) -J-17 Elevation Pumpage 642.0 641.0 640.0 01/01/00 01/03/00 01/05/00 01/07/00 01/09/00 01/11/00 01/13/00 01/15/00 01/17/00 01/19/00 01/21,00 01/23/00 01/25/00 01/27/00 01/29/00 01/31/00 9) What do you think caused the decreases pumping around January 30, 10", 17" and 27h? 10) What type of correlation is there between the daily pumping and water elevations? Elevation (feet above msl) 620.0 630.0 640.0 660.0 670.0 680.0 J-17 and Comal Springs 12) If so, give two dates where this is most pronounced. 11) Do you see any correlation between spring flow and aquifer water elevations? 01/01/00 01/14/00 01/27/00 02/09/00 02/22/00 03/06/00 03/19/00 04/01/00 04/14/00 04/27/00 05/10/00 05/23/00 06/05/00 06/18/00 07/01/00 07/14/00 07/27/00 The following graph shows aquifer levels and spring flow at Comal springs for 2000. Springflow 300 350 400 -Comal -J-17 Elevation