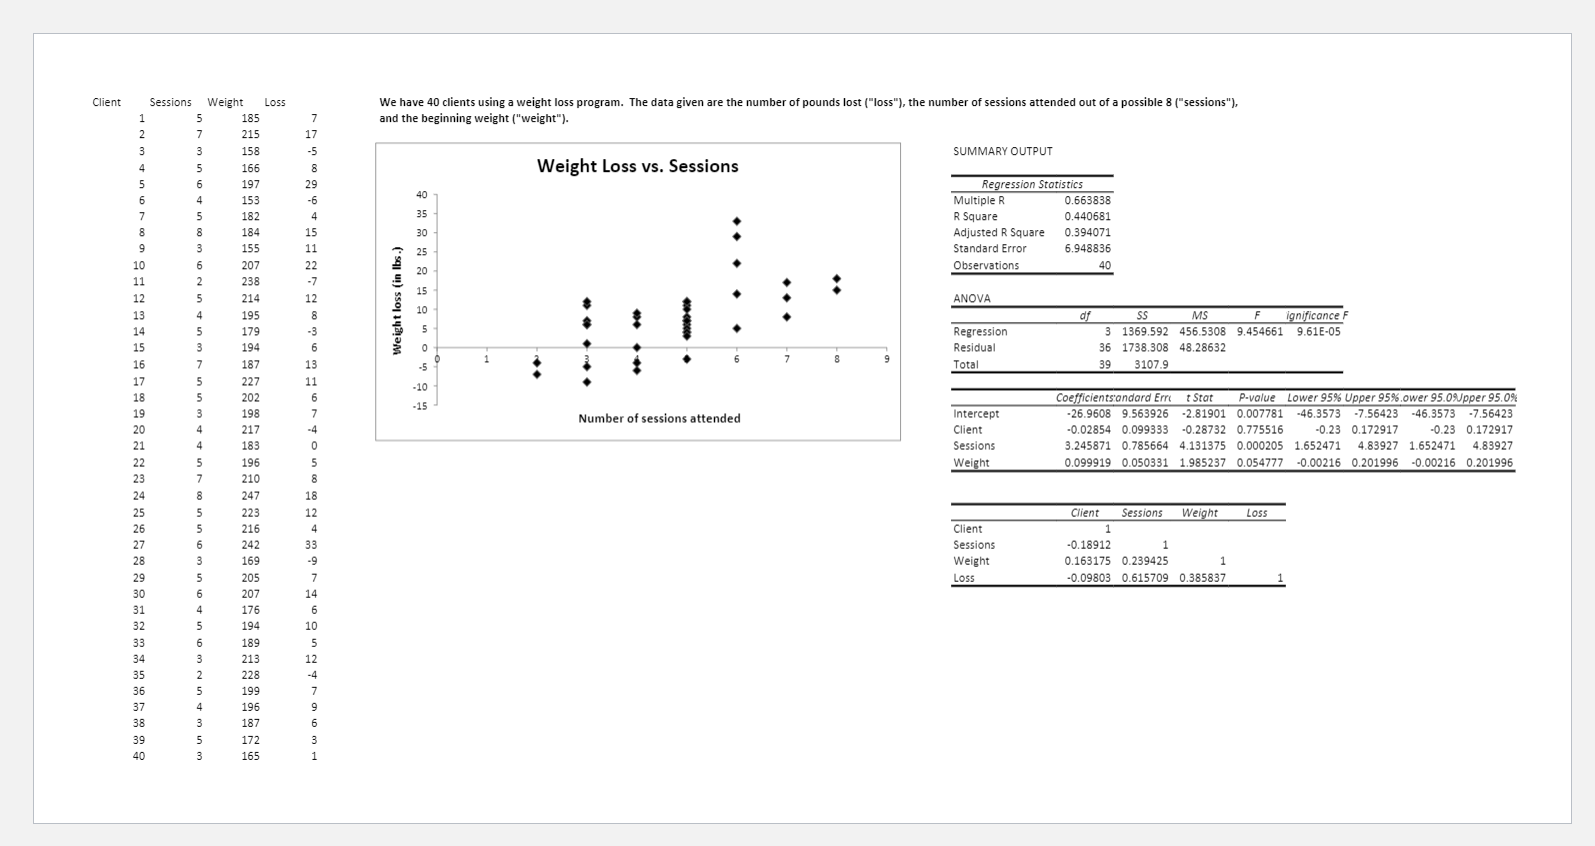
We are building a model to predict the percentage of defective pieces of fabric in a run. We are using three variables to build the model: basis weight (in grams), tensile strength (in grams/square inch), and thickness (in mils). 1.Who would be interested in this type of data?Explain. 2.What relationships would you expect to see between the other variables and defect percentage? 3.Obtain the correlation matrix and discuss. 4.Run the overall regression, and write the equation obtained. 5.Comment on the following: a.Statistical significance of the model. b.Goodness of fit. c.Statistical significance of each x-variable. d.Multicollinearity. 6.Use the methodology discussed in the Tegrity video and PowerPoint to determine the best model. 7.In a managerial capacity, what overall conclusions would you reach based on the analysis? 8.What recommendations would you make?
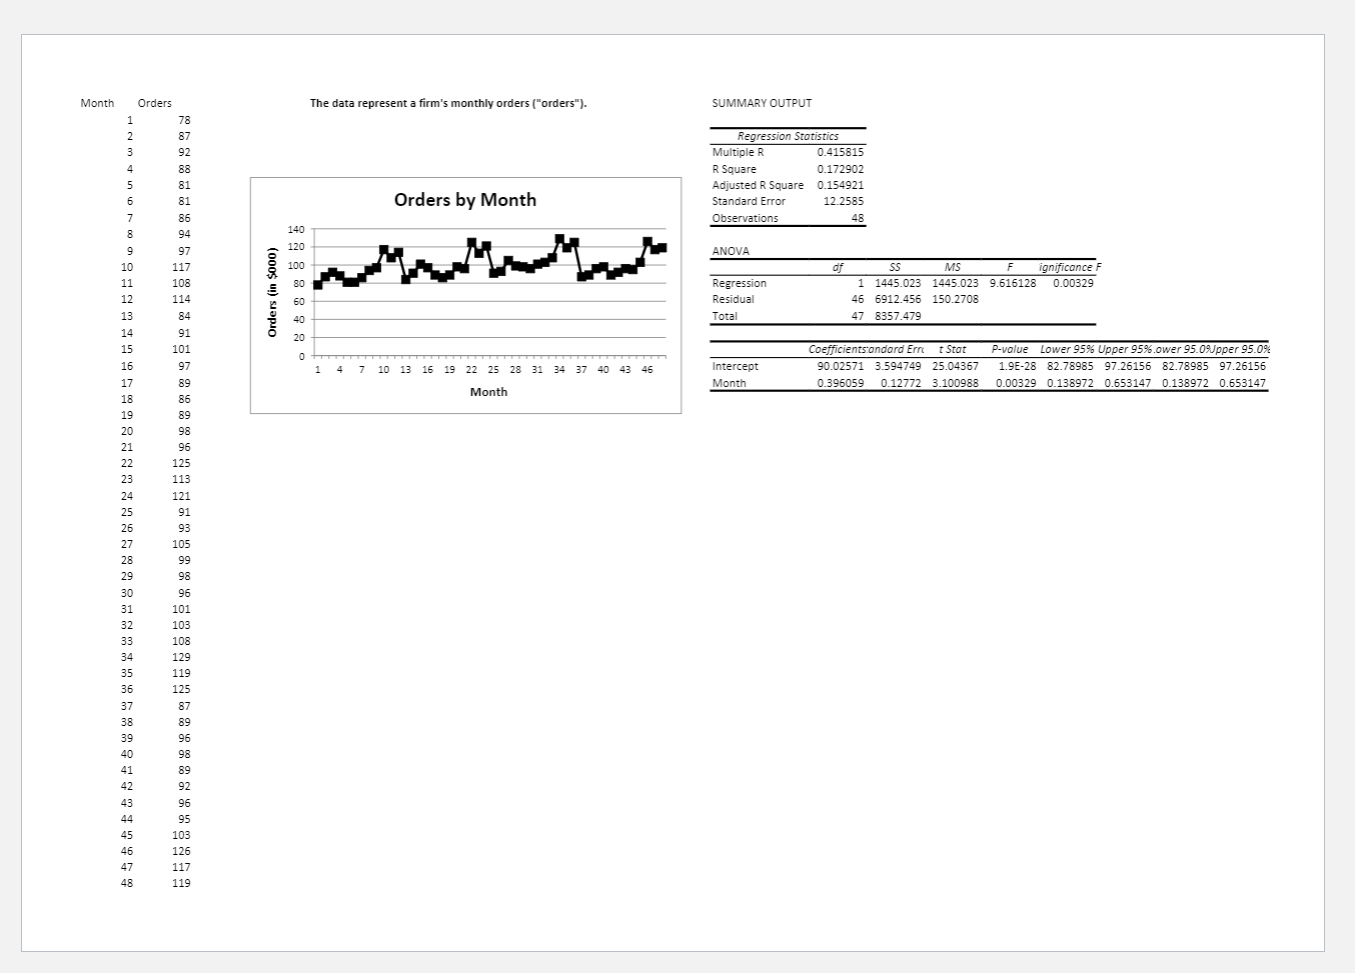
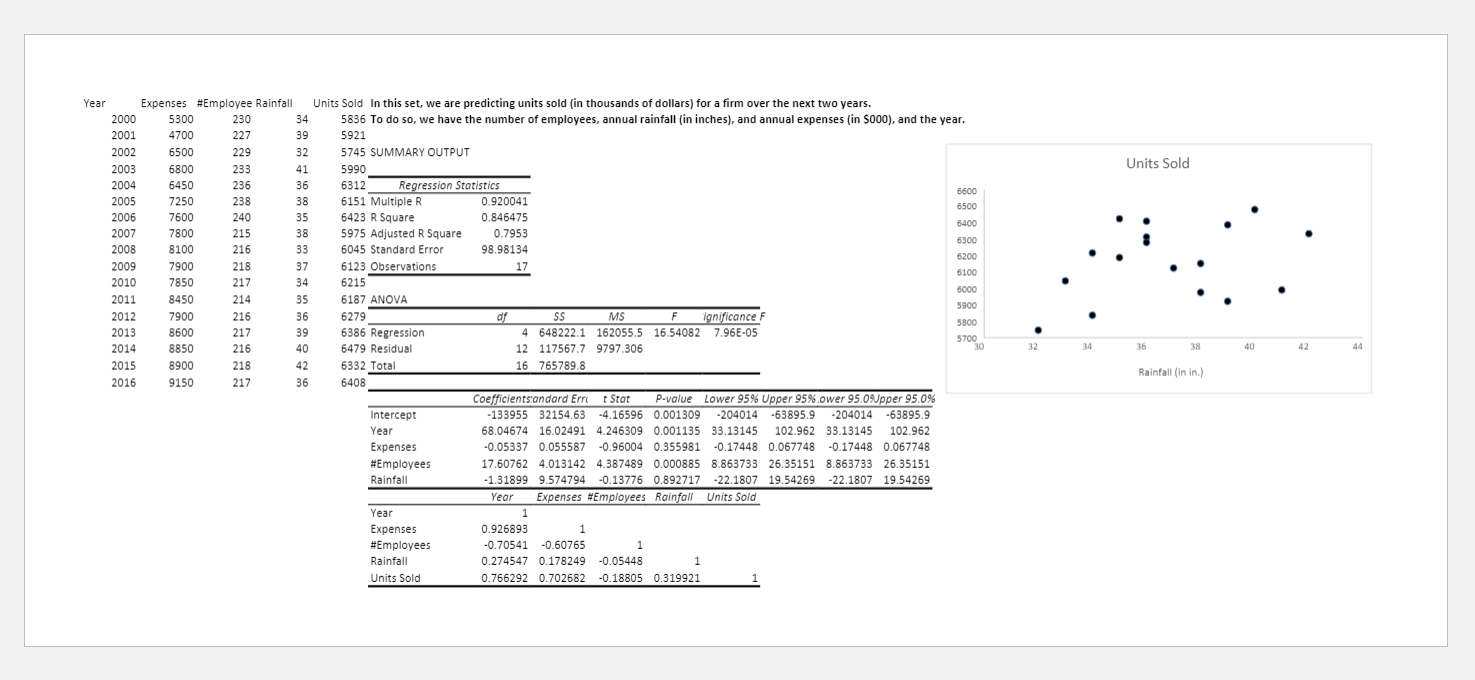
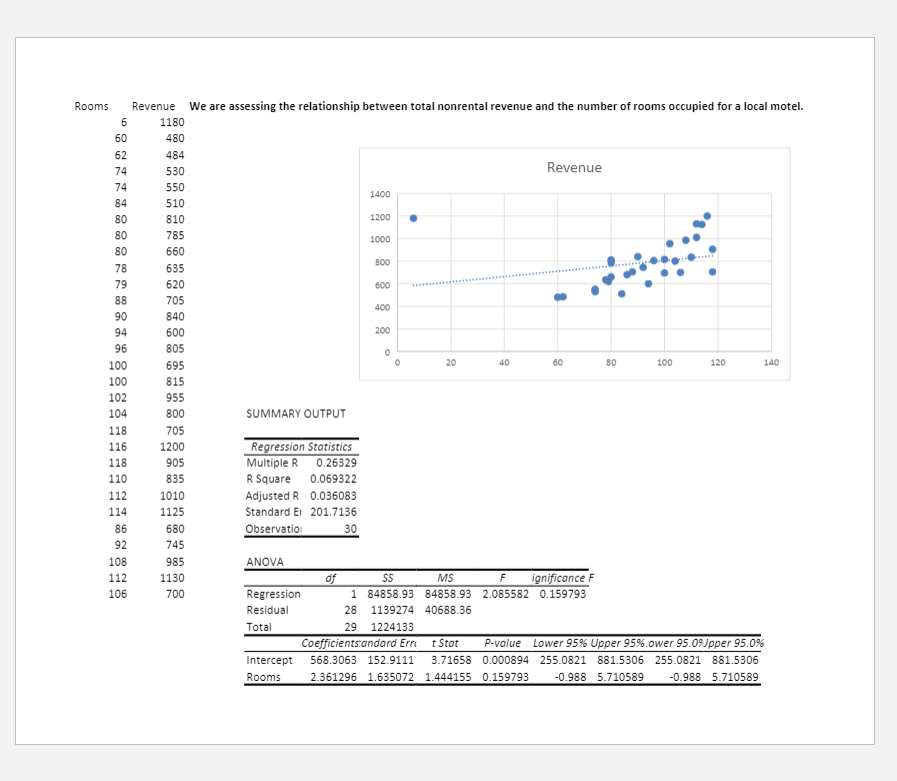
\fMonth Orders The data represent a firm's monthly orders ("orders"). SUMMARY OUTPUT Regression Statistics Multiple 0.415815 R Square 0.172902 Adjusted R Square 0.154921 Orders by Month Standard Error 12.2585 Observations 48 ANOVA of SS MS ignificance F Regression 1445.023 1445.023 9.616128 0.00329 Orders (in $000) Residual 6912.456 150.2708 Total 47 8357.479 Coefficients andard Ern t Stat P-value Lower 95% Upper 95% ower 95.0%Upper 95.0% 10 13 16 19 22 25 28 31 34 37 40 Intercept 90.02571 3.594749 25.04367 1.9E-28 82.78985 97.26156 82.78985 97.26156 Month 0.396059 Month 0.12772 3.100988 0.00329 0.138972 0.653147 0.138972 0.653147Year Expenses #Employee Rainfall Units Sold In this set, we are predicting units sold (in thousands of dollars) for a firm over the next two years. 2000 5300 230 34 5836 To do so, we have the number of employees, annual rainfall (in inches), and annual expenses (in $000), and the year. 2001 4700 227 39 5921 2002 6500 229 32 5745 SUMMARY OUTPUT Units Sold 2003 6800 233 41 5990 2004 6450 236 36 6312 Regression Statistics 5600 2005 7250 238 38 6151 Multiple R 0.920041 6500 2006 760 240 35 6423 R Square 0.846475 6400 2007 7800 215 38 5975 Adjusted R Square 0.7953 6300 2008 8100 216 33 6045 Standard Error 98.98134 6200 2009 7900 218 37 6123 Observations 17 6100 2010 7850 217 34 6215 6000 2011 8450 214 35 6187 ANOVA 5900 2012 7900 216 36 6279 of SS MS F anificance F 5800 2013 8600 217 39 6386 Regression 4 648222.1 162055.5 16.54082 7.96E-05 5700 12 117567.7 9797.306 30 32 34 36 38 40 42 44 2014 8850 216 40 6479 Residual 2015 8900 218 42 6332 Total 16 765789.8 Rainfall (in in.) 2016 9150 217 36 5408 Coefficients:andard Errt t Stat P-value Lower 95% Upper 95% ower 95.09Upper 95.0% Intercept 133955 32154.63 -4.16596 0.001309 -204014 -63895.9 -204014 -63895.9 Year 68.04674 16.02491 4.246309 0.001135 33.13145 102.962 33.13145 102.962 Expenses -0.05337 0.055587 -0.96004 0.355981 -0.17448 0.067748 -0.17448 0.067748 #Employees 17.60762 4.013142 4.387489 0.000885 8.863733 26.35151 8.863733 26.35151 Rainfall -1.31899 9.574794 -0.13776 0.892717 -22.1807 19.54269 -22.1807 19.54269 Year Expenses #Employees Rainfall Units Sold Year Expenses 0.926893 #Employees -0.70541 -0.60765 Rainfall 0.274547 0.178249 -0.05448 Units Sold 0.766292 0.702682 -0.18805 0.319921Rooms Revenue We are assessing the relationship between total nonrental revenue and the number of rooms occupied for a local motel. 6 1180 60 480 62 484 Revenue 74 530 74 550 1400 84 510 80 810 1200 80 785 1000 80 099 BOO 78 635 79 620 600 88 705 400 90 840 94 600 200 96 805 20 40 60 100 120 140 100 695 100 815 102 955 104 800 SUMMARY OUTPUT 118 705 116 1200 Regression Statistics 118 905 Multiple R 0.26329 110 835 R Square 0.069322 112 1010 Adjusted R 0.036083 114 1125 Standard Er 201.7136 86 680 Observation 30 92 745 108 985 ANOVA 112 1130 of SS MS F ignificance F 106 700 Regression 1 84858.93 84858.93 2.085582 0.159793 Residual 28 1139274 40688.36 Total 29 1224133 Coefficientstandard Err t Stat P-value Lower 95% Upper 95% ower 95.09pper 95.0% Intercept 568.3063 152.9111 3.71658 0.000894 255.0821 881.5306 255.0821 881.5306 2.361296 1.635072 1.444155 0.159793 -0.988 5.710589 -0.988 5.710589 Rooms