

Question
we considered the situation where we have a box containing an unknown number?say N?of identical bolts. In order to get an idea of the size
we considered the situation where we have a box
containing an unknown number?say N?of identical bolts. In order to get an
idea of the size of N we introduced three random variables X, Y , and Z. Here
we will use X and Y , and in the next exercise Z, to find maximum likelihood
estimates of N.
a. Suppose that x1, x2,...,xn is a dataset, which is a realization of a random
sample from a Geo(1/N) distribution. Determine the maximum likelihood
estimate for N.
b. Suppose that y1, y2,...,yn is a dataset, which is a realization of a random
sample from a discrete uniform distribution on 1, 2,...,N. Determine the
maximum likelihood estimate for N.
21.12 (Exercise 21.11 continued.) Suppose that m bolts in the box were
marked and then r bolts were selected from the box; Z is the number of
marked bolts in the sample. (Recall that it was shown in Exercise 4.13 c that
Z has a hypergeometric distribution, with parameters m, N, and r.) Suppose
that k bolts in the sample were marked. Show that the likelihood L(N) is
given by
L(N) =
m
k
N?m
r?k
N
r
.
Next show that L(N) increases for N mr/k,
and conclude that mr/k is the maximum likelihood estimate for N.
(a) Fred visits Blotchville again. He finds that the city has installed an electronic display
at the bus stop, showing the time when the previous bus arrived. The times between
arrivals of buses are still independent Exponentials with mean 10 minutes. Fred waits
for the next bus, and then records the time between that bus and the previous bus. On
average, what length of time between buses does he see?
(b) Fred then visits Blunderville, where the times between buses are also 10 minutes on
average, and independent. Yet to his dismay, he finds that on average he has to wait more
than 1 hour for the next bus when he arrives at the bus stop! How is it possible that the
average Fred-to-bus time is greater than the average bus-to-bus time even though Fred
arrives at some time between two bus arrivals? Explain this intuitively, and construct a
specific discrete distribution for the times between buses showing that this is possible.
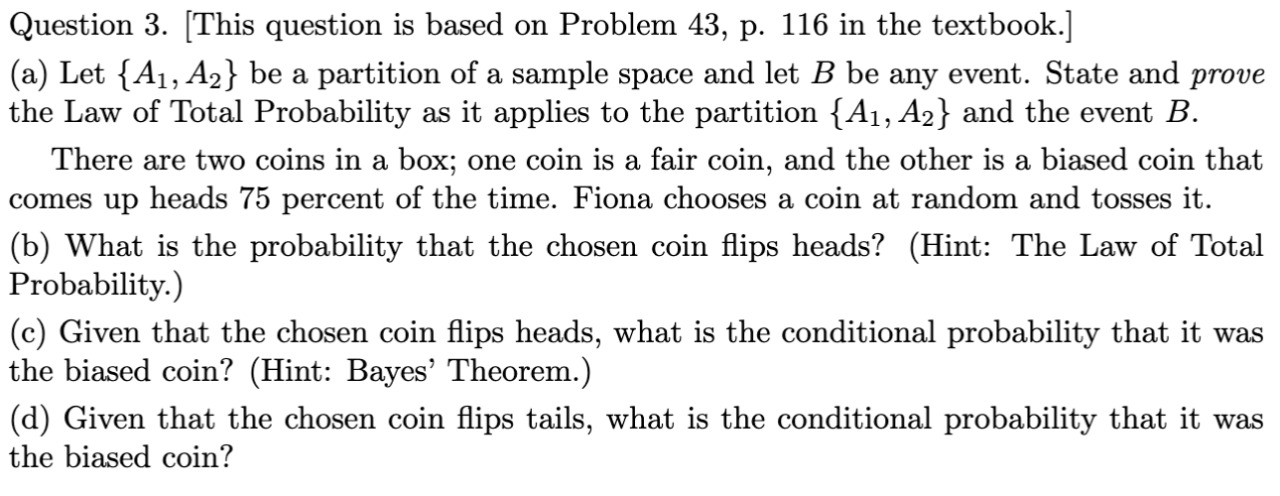
43. Fred and Gretchen are waiting at a bus stop in Blotchville. Two bus routes, Route 1
and Route 2, have buses that stop at this bus stop. For Route i, buses arrive according
to a Poisson process with rate.
Step by Step Solution
There are 3 Steps involved in it
Step: 1

Get Instant Access to Expert-Tailored Solutions
See step-by-step solutions with expert insights and AI powered tools for academic success
Step: 2

Step: 3
Ace Your Homework with AI
Get the answers you need in no time with our AI-driven, step-by-step assistance
Get Started
Square Summable Power Series
Authors: Louis De Branges, James Rovnyak
1st Edition
0486801365, 9780486801360