Question
We continue our analysis of the U.S. elderly population, this time examining the num- ber of elderly from 1900 to 2000. A bar graph

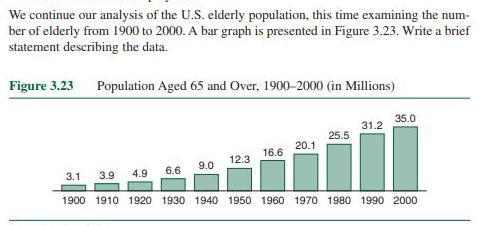
We continue our analysis of the U.S. elderly population, this time examining the num- ber of elderly from 1900 to 2000. A bar graph is presented in Figure 3.23. Write a brief statement describing the data. Figure 3.23 Population Aged 65 and Over, 1900-2000 (in Millions) 35.0 31.2 25.5 20.1 16.6 12.3 9.0 3.1 3.9 4.9 6.6 1900 1910 1920 1930 1940 1950 1960 1970 1980 1990 2000
Step by Step Solution
3.37 Rating (156 Votes )
There are 3 Steps involved in it
Step: 1
In this graph we see that the population ...
Get Instant Access to Expert-Tailored Solutions
See step-by-step solutions with expert insights and AI powered tools for academic success
Step: 2

Step: 3

Ace Your Homework with AI
Get the answers you need in no time with our AI-driven, step-by-step assistance
Get StartedRecommended Textbook for
Fundamentals Of Statistics
Authors: Michael Sullivan III
4th Edition
978-032184460, 032183870X, 321844602, 9780321838704, 978-0321844606
Students also viewed these Mathematics questions
Question
Answered: 1 week ago
Question
Answered: 1 week ago
Question
Answered: 1 week ago
Question
Answered: 1 week ago
Question
Answered: 1 week ago
Question
Answered: 1 week ago
Question
Answered: 1 week ago
Question
Answered: 1 week ago
Question
Answered: 1 week ago
Question
Answered: 1 week ago
Question
Answered: 1 week ago
Question
Answered: 1 week ago
Question
Answered: 1 week ago
Question
Answered: 1 week ago
Question
Answered: 1 week ago
Question
Answered: 1 week ago
Question
Answered: 1 week ago
Question
Answered: 1 week ago
Question
Answered: 1 week ago
Question
Answered: 1 week ago
View Answer in SolutionInn App


