We doubled the concentration of iodate ion, halved it, and kept it how it was in the procedure. That is the 3 trials.
Data:
original concentration = 13.37 seconds
doubling concentrations =7.73 seconds
halving concentration =1 min 11 seconds
Please answer question 2 a and b. I also attached the procedure that has the initial concentrations
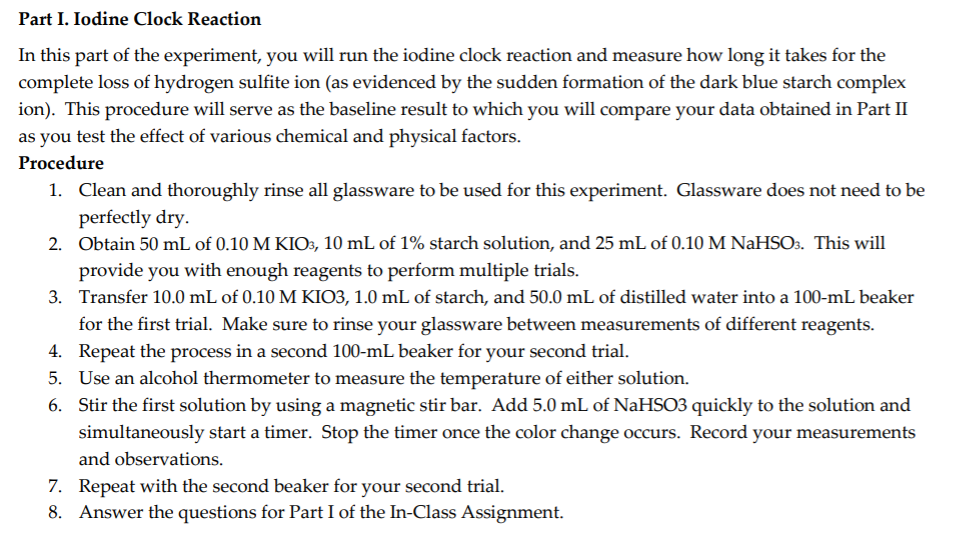
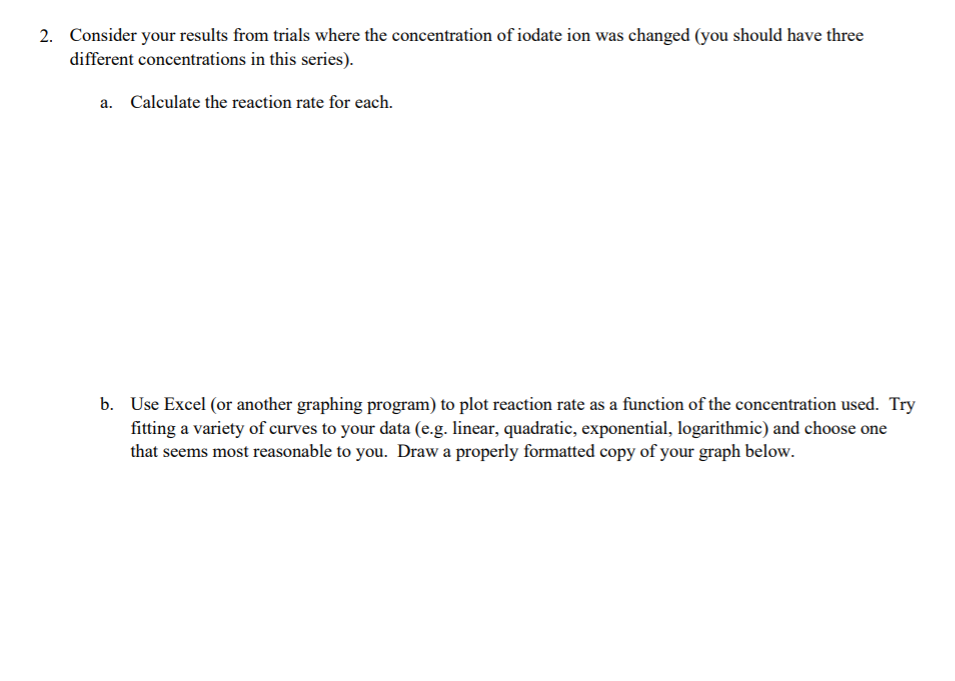
Part I. Iodine Clock Reaction In this part of the experiment, you will run the iodine clock reaction and measure how long it takes for the complete loss of hydrogen sulfite ion (as evidenced by the sudden formation of the dark blue starch complex ion). This procedure will serve as the baseline result to which you will compare your data obtained in Part II as you test the effect of various chemical and physical factors. Procedure 1. Clean and thoroughly rinse all glassware to be used for this experiment. Glassware does not need to be perfectly dry. 2. Obtain 50 mL of 0.10 M KIOs, 10 mL of 1% starch solution, and 25 mL of 0.10 M NaHSO3. This will provide you with enough reagents to perform multiple trials. 3. Transfer 10.0 mL of 0.10 M KIO3, 1.0 mL of starch, and 50.0 mL of distilled water into a 100-ml beaker for the first trial. Make sure to rinse your glassware between measurements of different reagents. 4. Repeat the process in a second 100-ml beaker for your second trial. 5. Use an alcohol thermometer to measure the temperature of either solution. 6. Stir the first solution by using a magnetic stir bar. Add 5.0 mL of NaHSO3 quickly to the solution and simultaneously start a timer. Stop the timer once the color change occurs. Record your measurements and observations. 7. Repeat with the second beaker for your second trial. 8. Answer the questions for Part I of the In-Class Assignment. 2. Consider your results from trials where the concentration of iodate ion was changed (you should have three different concentrations in this series). a. Calculate the reaction rate for each. b. Use Excel (or another graphing program) to plot reaction rate as a function of the concentration used. Try fitting a variety of curves to your data (e.g. linear, quadratic, exponential, logarithmic) and choose one that seems most reasonable to you. Draw a properly formatted copy of your graph below. Part I. Iodine Clock Reaction In this part of the experiment, you will run the iodine clock reaction and measure how long it takes for the complete loss of hydrogen sulfite ion (as evidenced by the sudden formation of the dark blue starch complex ion). This procedure will serve as the baseline result to which you will compare your data obtained in Part II as you test the effect of various chemical and physical factors. Procedure 1. Clean and thoroughly rinse all glassware to be used for this experiment. Glassware does not need to be perfectly dry. 2. Obtain 50 mL of 0.10 M KIOs, 10 mL of 1% starch solution, and 25 mL of 0.10 M NaHSO3. This will provide you with enough reagents to perform multiple trials. 3. Transfer 10.0 mL of 0.10 M KIO3, 1.0 mL of starch, and 50.0 mL of distilled water into a 100-ml beaker for the first trial. Make sure to rinse your glassware between measurements of different reagents. 4. Repeat the process in a second 100-ml beaker for your second trial. 5. Use an alcohol thermometer to measure the temperature of either solution. 6. Stir the first solution by using a magnetic stir bar. Add 5.0 mL of NaHSO3 quickly to the solution and simultaneously start a timer. Stop the timer once the color change occurs. Record your measurements and observations. 7. Repeat with the second beaker for your second trial. 8. Answer the questions for Part I of the In-Class Assignment. 2. Consider your results from trials where the concentration of iodate ion was changed (you should have three different concentrations in this series). a. Calculate the reaction rate for each. b. Use Excel (or another graphing program) to plot reaction rate as a function of the concentration used. Try fitting a variety of curves to your data (e.g. linear, quadratic, exponential, logarithmic) and choose one that seems most reasonable to you. Draw a properly formatted copy of your graph below