Answered step by step
Verified Expert Solution
Link Copied!

Question

1 Approved Answer

We give JMP output of regression analysis. Above output we give the regression model and the number of observations, n , used to perform the

We give JMP output of regression analysis. Above output we give the regression model and the number of observations,n, used to perform the regression analysis under consideration. Using the model, sample sizen, and output:
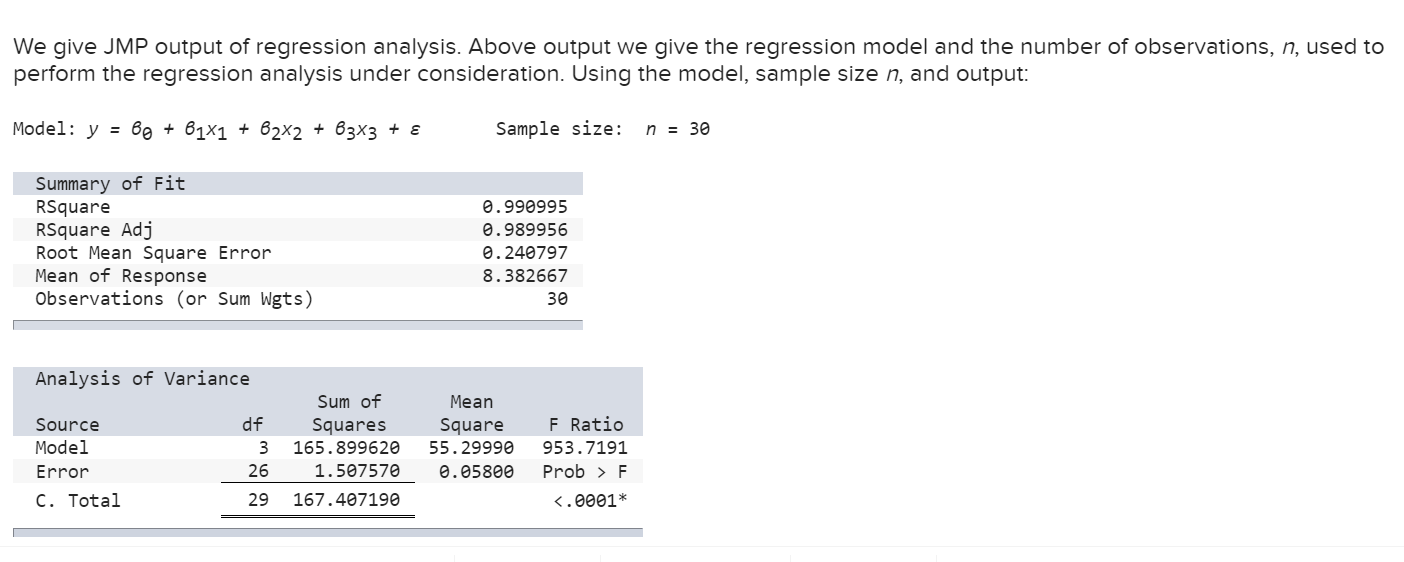
image text in transcribedimage text in transcribed
We give JMP output of regression analysis. Above output we give the regression model and the number of observations, n, used to perform the regression analysis under consideration. Using the model, sample size n, and output: Model: y = 69 + Slxl + 62x2 + B3X3 + E Sample size: n = 36 Summary of Fit RSquare 6.998995 RSquare Adj 6.989956 Root Mean Square Error 6.246797 Mean of Response 8.382667 Observations (or Sum Ngts) 36 Analysis of Variance Sum of Mean Source df Squares Square F Ratio Model 3 155.399628 55.29999 953.7191 Error 26 1.567576 6.65866 Prob > F C. Total 29 151467196 <.6661 calculate the f statistic by using explained variation unexplained and other relevant quantities. your answer to decimal places. x is complete but not entirely correct.>

Step by Step Solution

There are 3 Steps involved in it

Step: 1

blur-text-image

Get Instant Access to Expert-Tailored Solutions

See step-by-step solutions with expert insights and AI powered tools for academic success

Step: 2

blur-text-image

Step: 3

blur-text-image

Ace Your Homework with AI

Get the answers you need in no time with our AI-driven, step-by-step assistance

Get Started

Recommended Textbook for

Mathematics Concepts With Applications

Authors: Charles P McKeague

1st Edition

1630983136, 9781630983130

More Books

Students also viewed these Mathematics questions

Question

Describe how language reflects, builds on, and determines context?

Answered: 1 week ago