Answered step by step
Verified Expert Solution
Link Copied!

Question

1 Approved Answer

We have the historical returns of two risky assets: Date asset Aasset_B 4/30/2020 5/31/2020 6/30/2020 7/31/2020 8/31/2020 9/30/2020 -0.1554 0.0851 0.1474 0.1651 0.2166 -0.1025 0.1363
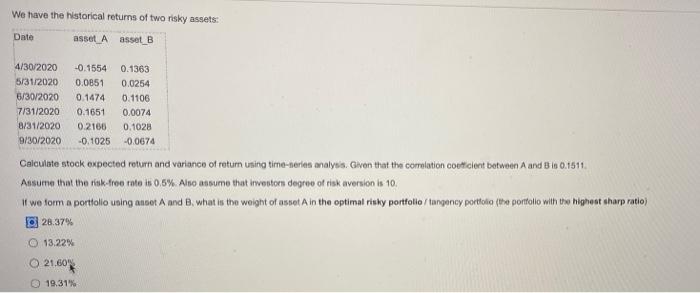
image text in transcribed
We have the historical returns of two risky assets: Date asset Aasset_B 4/30/2020 5/31/2020 6/30/2020 7/31/2020 8/31/2020 9/30/2020 -0.1554 0.0851 0.1474 0.1651 0.2166 -0.1025 0.1363 0.0254 0.1106 0.0074 0.1028 -0.0674 Calculate stock expected return and variance of return using time-serita analysis. Given that the correlation coeficient between A and B 16 0.1511 Assume that the risk-free rate is 0.5% Also assume that inventorn degree of risk aversion is 10. if we forma portfolio using anot A and B what is the weight of asset A in the optimal rinky portfolio /tangency portfolio (the portfolio with the highest sharp ratio) 28.37% 13.22% O 21.60 19.31%

Step by Step Solution

There are 3 Steps involved in it

Step: 1

blur-text-image

Get Instant Access to Expert-Tailored Solutions

See step-by-step solutions with expert insights and AI powered tools for academic success

Step: 2

blur-text-image

Step: 3

blur-text-image

Ace Your Homework with AI

Get the answers you need in no time with our AI-driven, step-by-step assistance

Get Started

Recommended Textbook for

Intermediate Financial Management

Authors: Brigham, Daves

10th Edition

978-1439051764, 1111783659, 9780324594690, 1439051763, 9781111783655, 324594690, 978-1111021573

More Books

Students also viewed these Finance questions