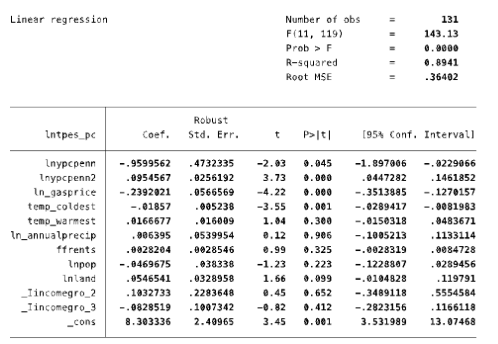
Question
We model energy use per capita of 131 countries in a given year as follows: Lntpes_pc = 0+1Lnypcpenn+ 2Lnypcpenn2+3LnGasprice+4LnAnnualprecip+ 5TempColdest+ 6TempWarmest+7ffrents+8LnPop+9LnLand+D_incomegroups+u The variables are defined
We model energy use per capita of 131 countries in a given year as follows:
Lntpes_pc = 0+1Lnypcpenn+ 2Lnypcpenn2+3LnGasprice+4LnAnnualprecip+ 5TempColdest+ 6TempWarmest+7ffrents+8LnPop+9LnLand+D_incomegroups+u
The variables are defined as follows:
Lntpes_pc = log of total primary energy consumption per capita (ktoe)
Lnypcpenn =log of GDP per capita (USD)
Lnypcpenn2 = square of log of GDP per capita (USD)
Ln_gasprice = log of pump price for gasoline (USD/liter)
LnAnnualprecip= log of annual precipitation (mm)
Temp_coldest = average temperature for the coldest month in a year (in C)
Temp_warmest= average temperature for the warmest month in a year (in C)
ffrents = Fossil Fuel Rents (% of GDP)
LnPop = log of population (in millions)
LnLand = log of land area (in km2)
I_Incomegroup = refers to income groups ?1? , ?2? and ?3?, low, mid and high income countries.
*?Log? always refers to natural logs or ?ln? here.
Log referrers to natural logarithm!
Interpret the constant and its p-value.
Interpret the coefficient on gas price and its p-value.
Interpret the coefficient on annual precipitation and carry out a t-test to determine the significance of the coefficient.
Interpret the coefficient on population and its p-value.
12 marks
The above model belongs to the class of nonlinear equations. Calculate the turning point of the nonlinear relationship.
3 marks
Is this a U-shaped or inverted U-shaped relationship?
1 marks
Analyse the relationship between energy use per capita and GDP pc based on these insights. How does energy use per capita change with GDPpc? Prepare a graph!
4 marks
Please define MLR 2 and describe if MLR 2 is likely to hold or not?
3 marks
Please define MLR 4 and describe if MLR 4 is likely to hold or not?
Linear regression ffrents Inpop Inland Robust Coef. Std. Err. .038338 .0328958 _Iincomegro_2 .1032733 .2283648 _Tincomegro_3 -.0828519 .1007342 8.303336 2.49965 _cons Number of obs F(11, 119) Prob > F R-squared Root MSE Intpes_pc Lnypcpenn -.9599562 4732335 -2.03 0.045 -1.897906 Inypcpenn2 0256192 3.73 0.000 .0447282 .0954567 In_gasprice -.2392021 0566569 -4.22 0.000 -.3513885 temp_coldest -.01857 .005238 -3.55 0.001 -.0289417 temp_warmest .0166677 .016009 1.04 0.300 -.0150318 In annualprecip .806395 .0539954 0.12 0.906 -.1005213 .0028204 .0028546 -.0028319 -.0469675 -.1228807 .0546541 -.0104828 P>|t| = 0.99 0.325 -1.23 0.223 0.099 1.66 0.45 0.652 -0.82 0.412 3.45 0.001 = 131 143.13 0.0000 0.8941 .36402 [95% Conf. Intervall -.3489118 -.2823156 3.531989 -.0229066 .1461852 -.1270157 -.0081983 .0483671 .1133114 .0084728 0289456 .119791 .5554584 .1166118 13.07468
Step by Step Solution
3.47 Rating (150 Votes )
There are 3 Steps involved in it
Step: 1
Interpret the constant and its pvalue The constant in this model represents the expected value of log of total primary energy consumption per capita when all independent variables are equal to zero Th...
Get Instant Access to Expert-Tailored Solutions
See step-by-step solutions with expert insights and AI powered tools for academic success
Step: 2

Step: 3

Ace Your Homework with AI
Get the answers you need in no time with our AI-driven, step-by-step assistance
Get Started


