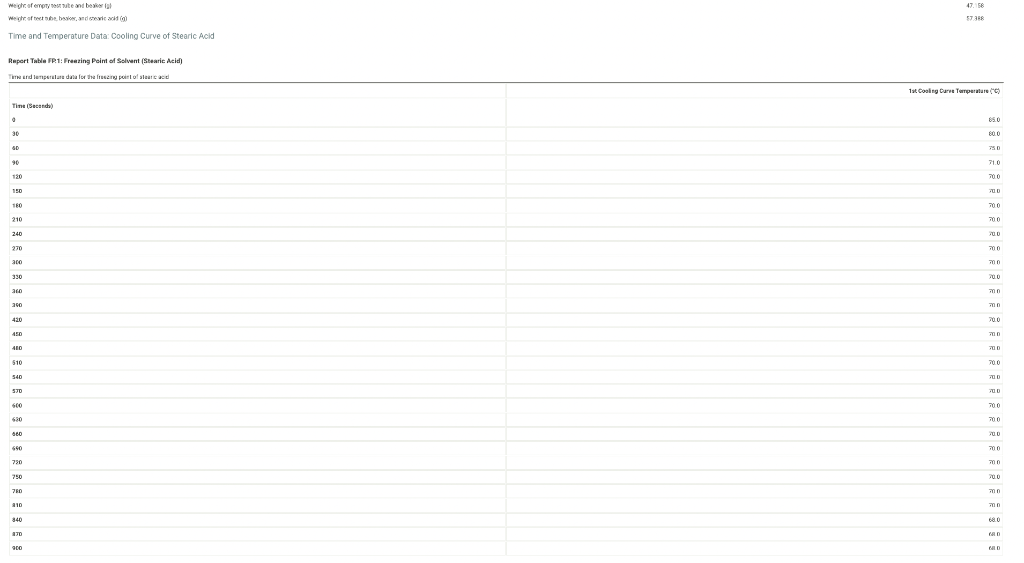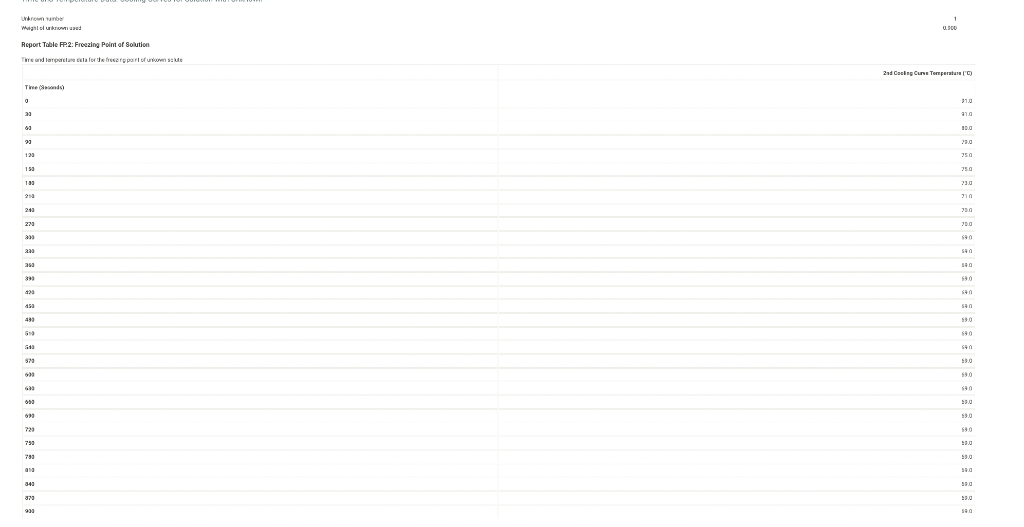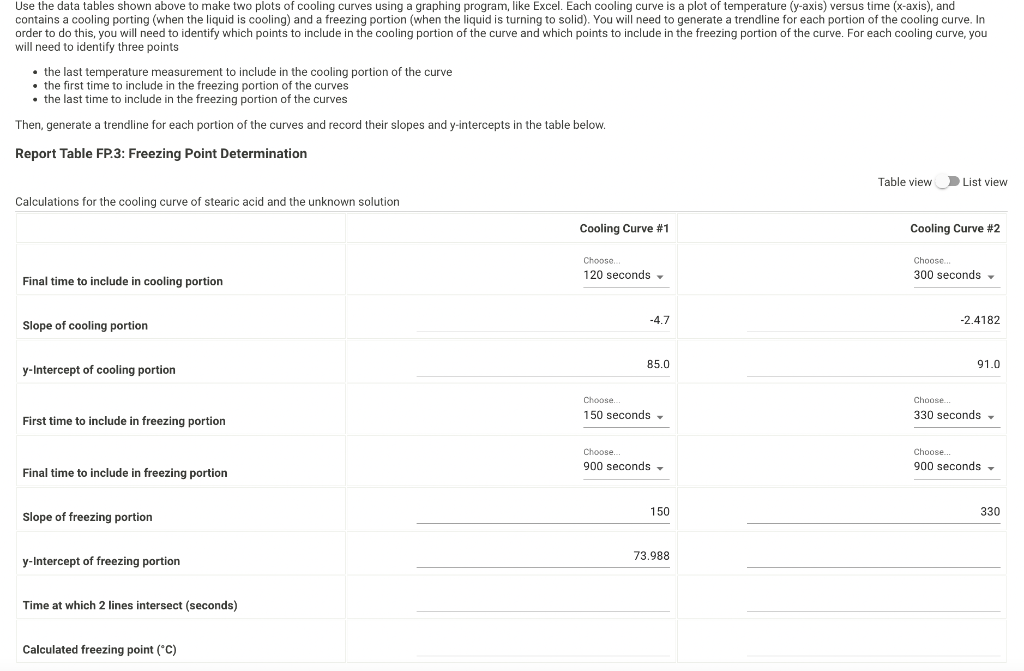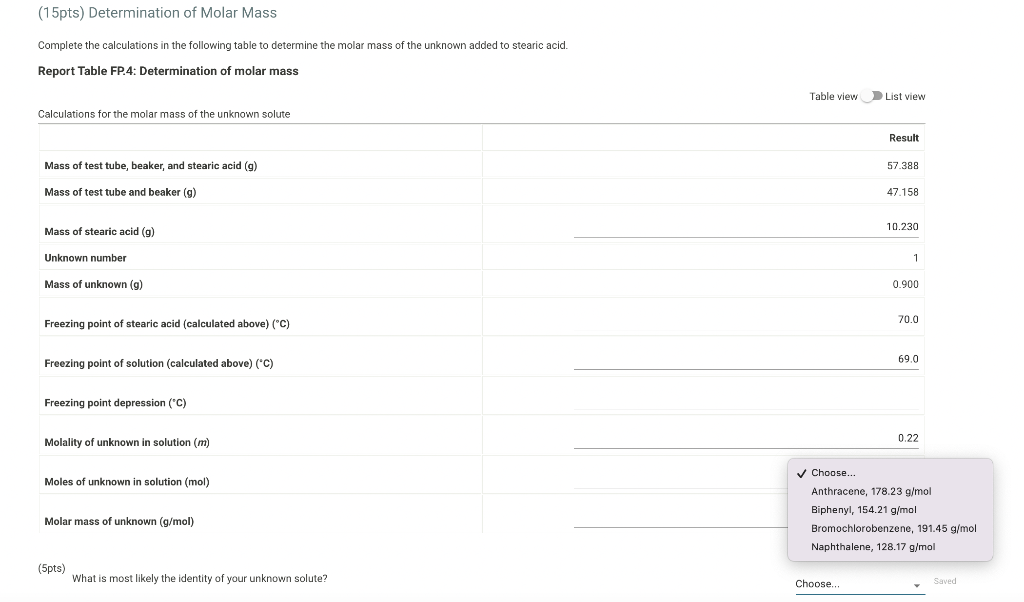


we ole of enpoy wor vate and bexis lal 47.156 Time and Temperature Data: Cooling Curve of Stearic Acid Repert Table fP1: Freazing Peimt of Selvent (Sesaric Meid) Tine (Secand) Use the data tables shown above to make two plots of cooling curves using a graphing program, like Excel. Each cooling curve is a plot of temperature ( y-axis) versus time ( x-axis), and contains a cooling porting (when the liquid is cooling) and a freezing portion (when the liquid is turning to solid). You will need to generate a trendline for each portion of the cooling curve. In order to do this, you will need to identify which points to include in the cooling portion of the curve and which points to include in the freezing portion of the curve. For each cooling curve, you will need to identify three points - the last temperature measurement to include in the cooling portion of the curve - the first time to include in the freezing portion of the curves - the last time to include in the freezing portion of the curves Then, generate a trendline for each portion of the curves and record their slopes and y-intercepts in the table below. (15pts) Determination of Molar Mass we ole of enpoy wor vate and bexis lal 47.156 Time and Temperature Data: Cooling Curve of Stearic Acid Repert Table fP1: Freazing Peimt of Selvent (Sesaric Meid) Tine (Secand) Use the data tables shown above to make two plots of cooling curves using a graphing program, like Excel. Each cooling curve is a plot of temperature ( y-axis) versus time ( x-axis), and contains a cooling porting (when the liquid is cooling) and a freezing portion (when the liquid is turning to solid). You will need to generate a trendline for each portion of the cooling curve. In order to do this, you will need to identify which points to include in the cooling portion of the curve and which points to include in the freezing portion of the curve. For each cooling curve, you will need to identify three points - the last temperature measurement to include in the cooling portion of the curve - the first time to include in the freezing portion of the curves - the last time to include in the freezing portion of the curves Then, generate a trendline for each portion of the curves and record their slopes and y-intercepts in the table below. (15pts) Determination of Molar Mass


